I do a lot of work with San Francisco crime data, and one of the things that I’ve been struggling with is one particular dataset: the locations of all the driving under the influence (DUI) arrests in the city. Just yesterday there was an article about US Senators asking Apple to remove DUI checkpoint applications from the app store.
San Francisco publishes a huge amount of crime data, going all the way back to 2003. You can grab a single CSV file with all the data. Over a million crimes. It’s beautiful.
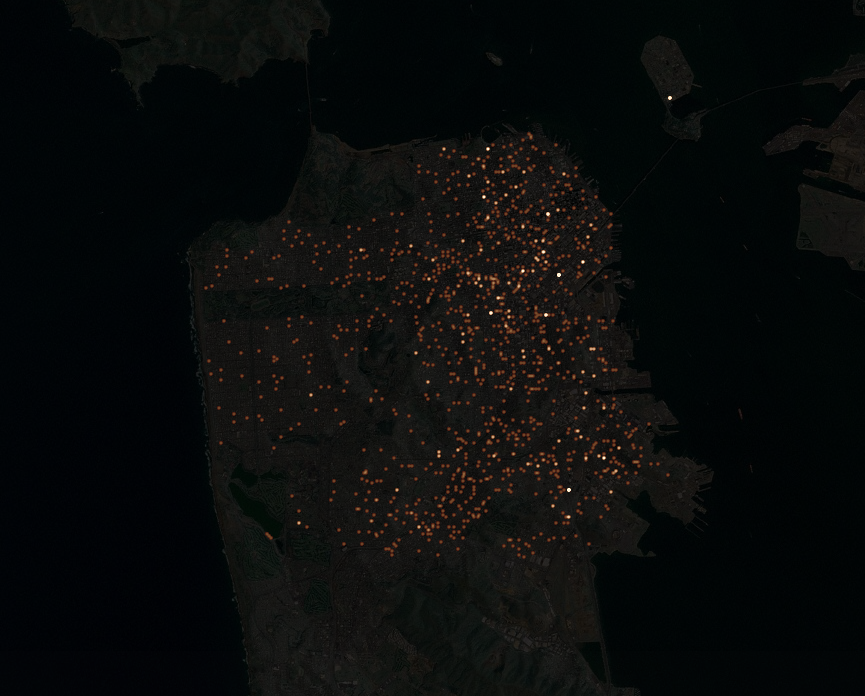
If you look at just the DUI records you start seeing patterns. Here’s about a thousand DUIs over the past 2 years (2009-2010). Click any of these images for larger versions of the maps.

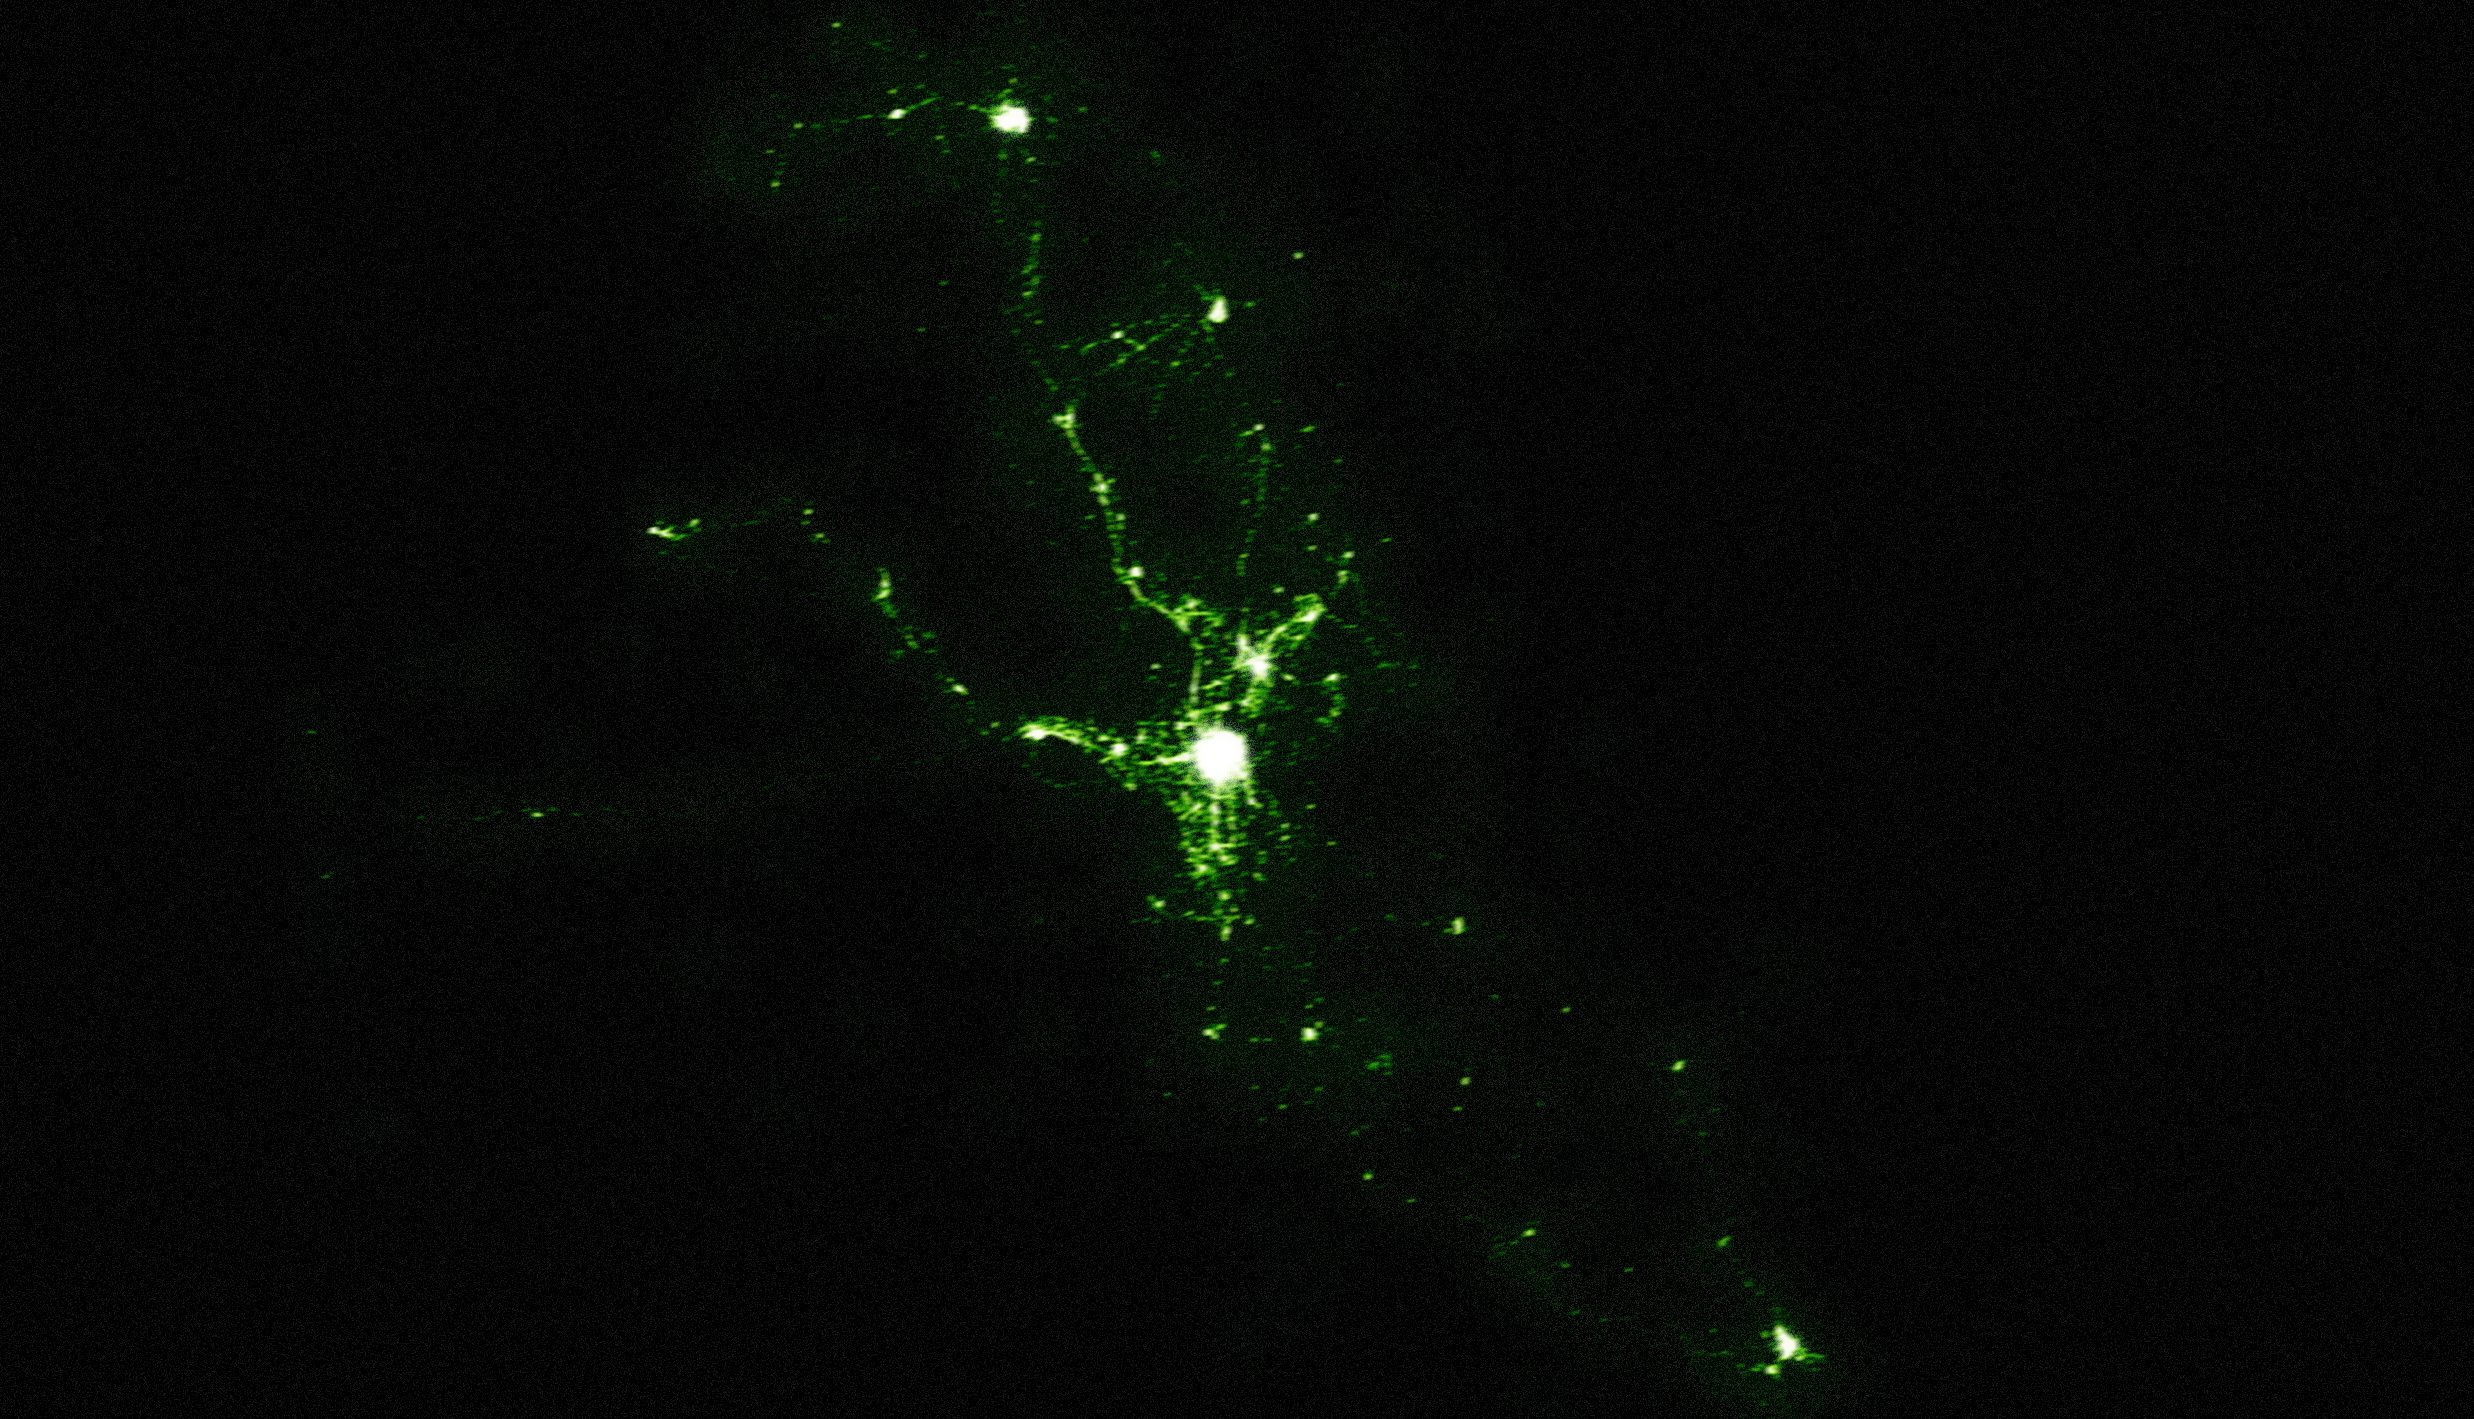
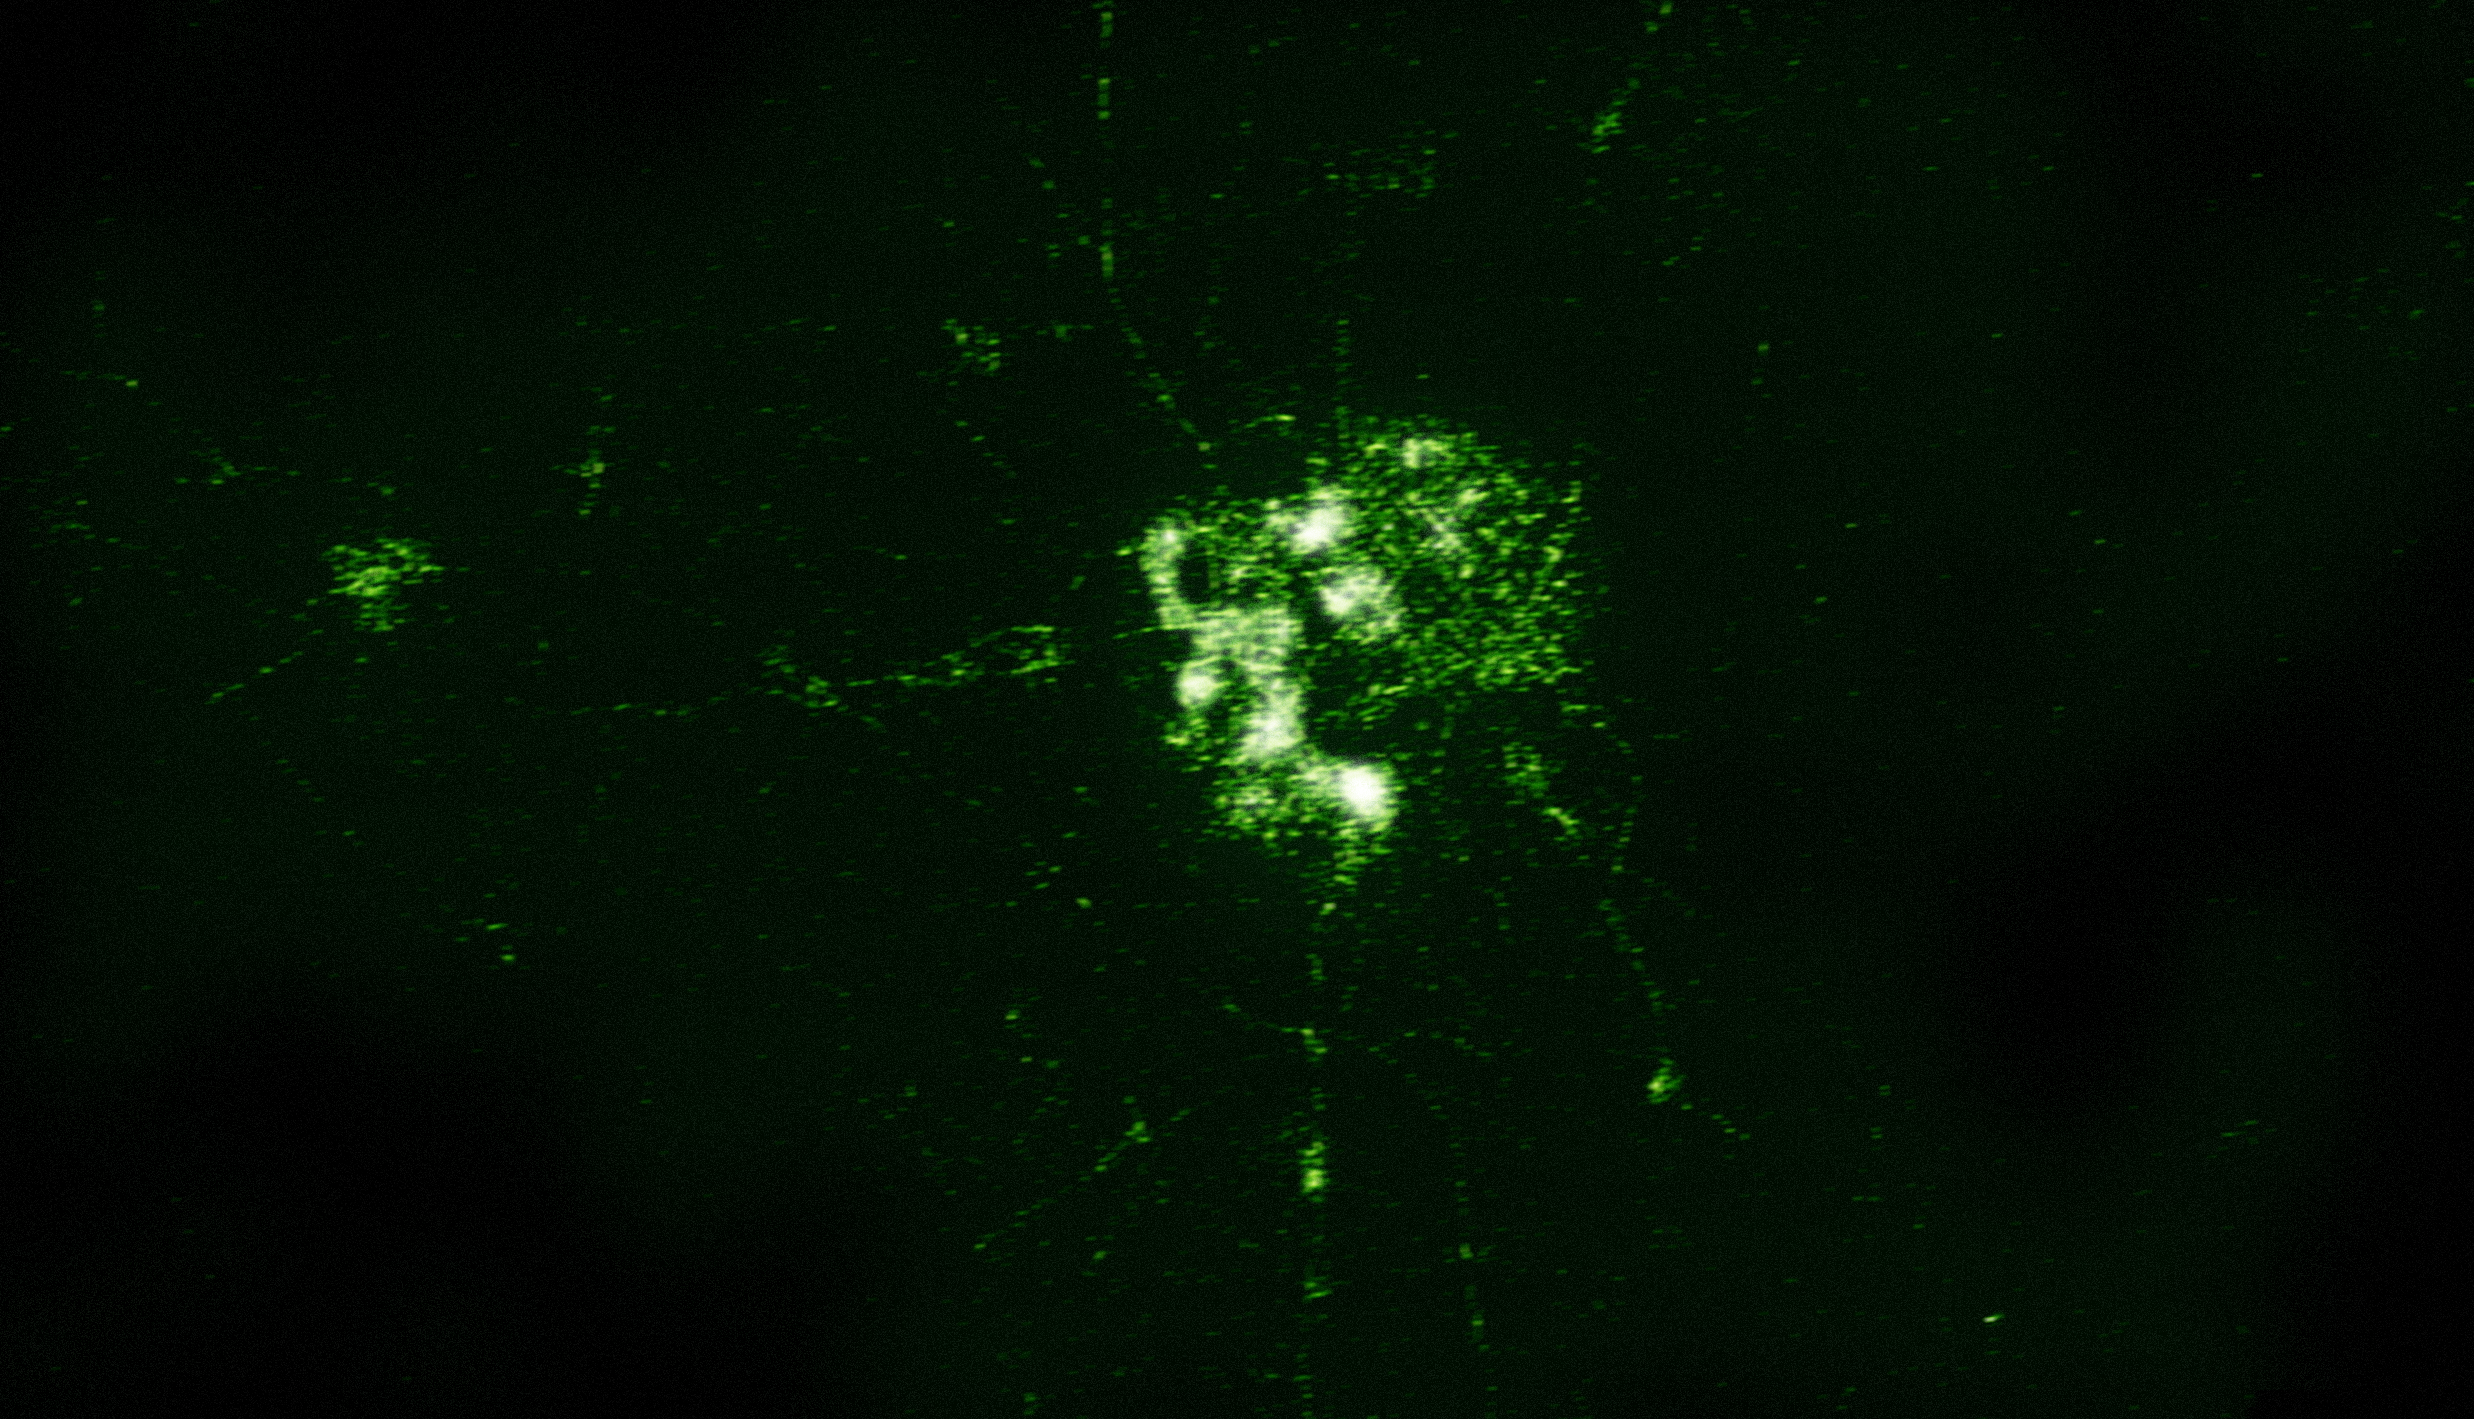
If we look at a density map individual streets start lighting up. Specific intersections stand out.

Here’s a representation that assigns the number of DUIs to the street segment they occurred on and colors the data like a typical traffic map.

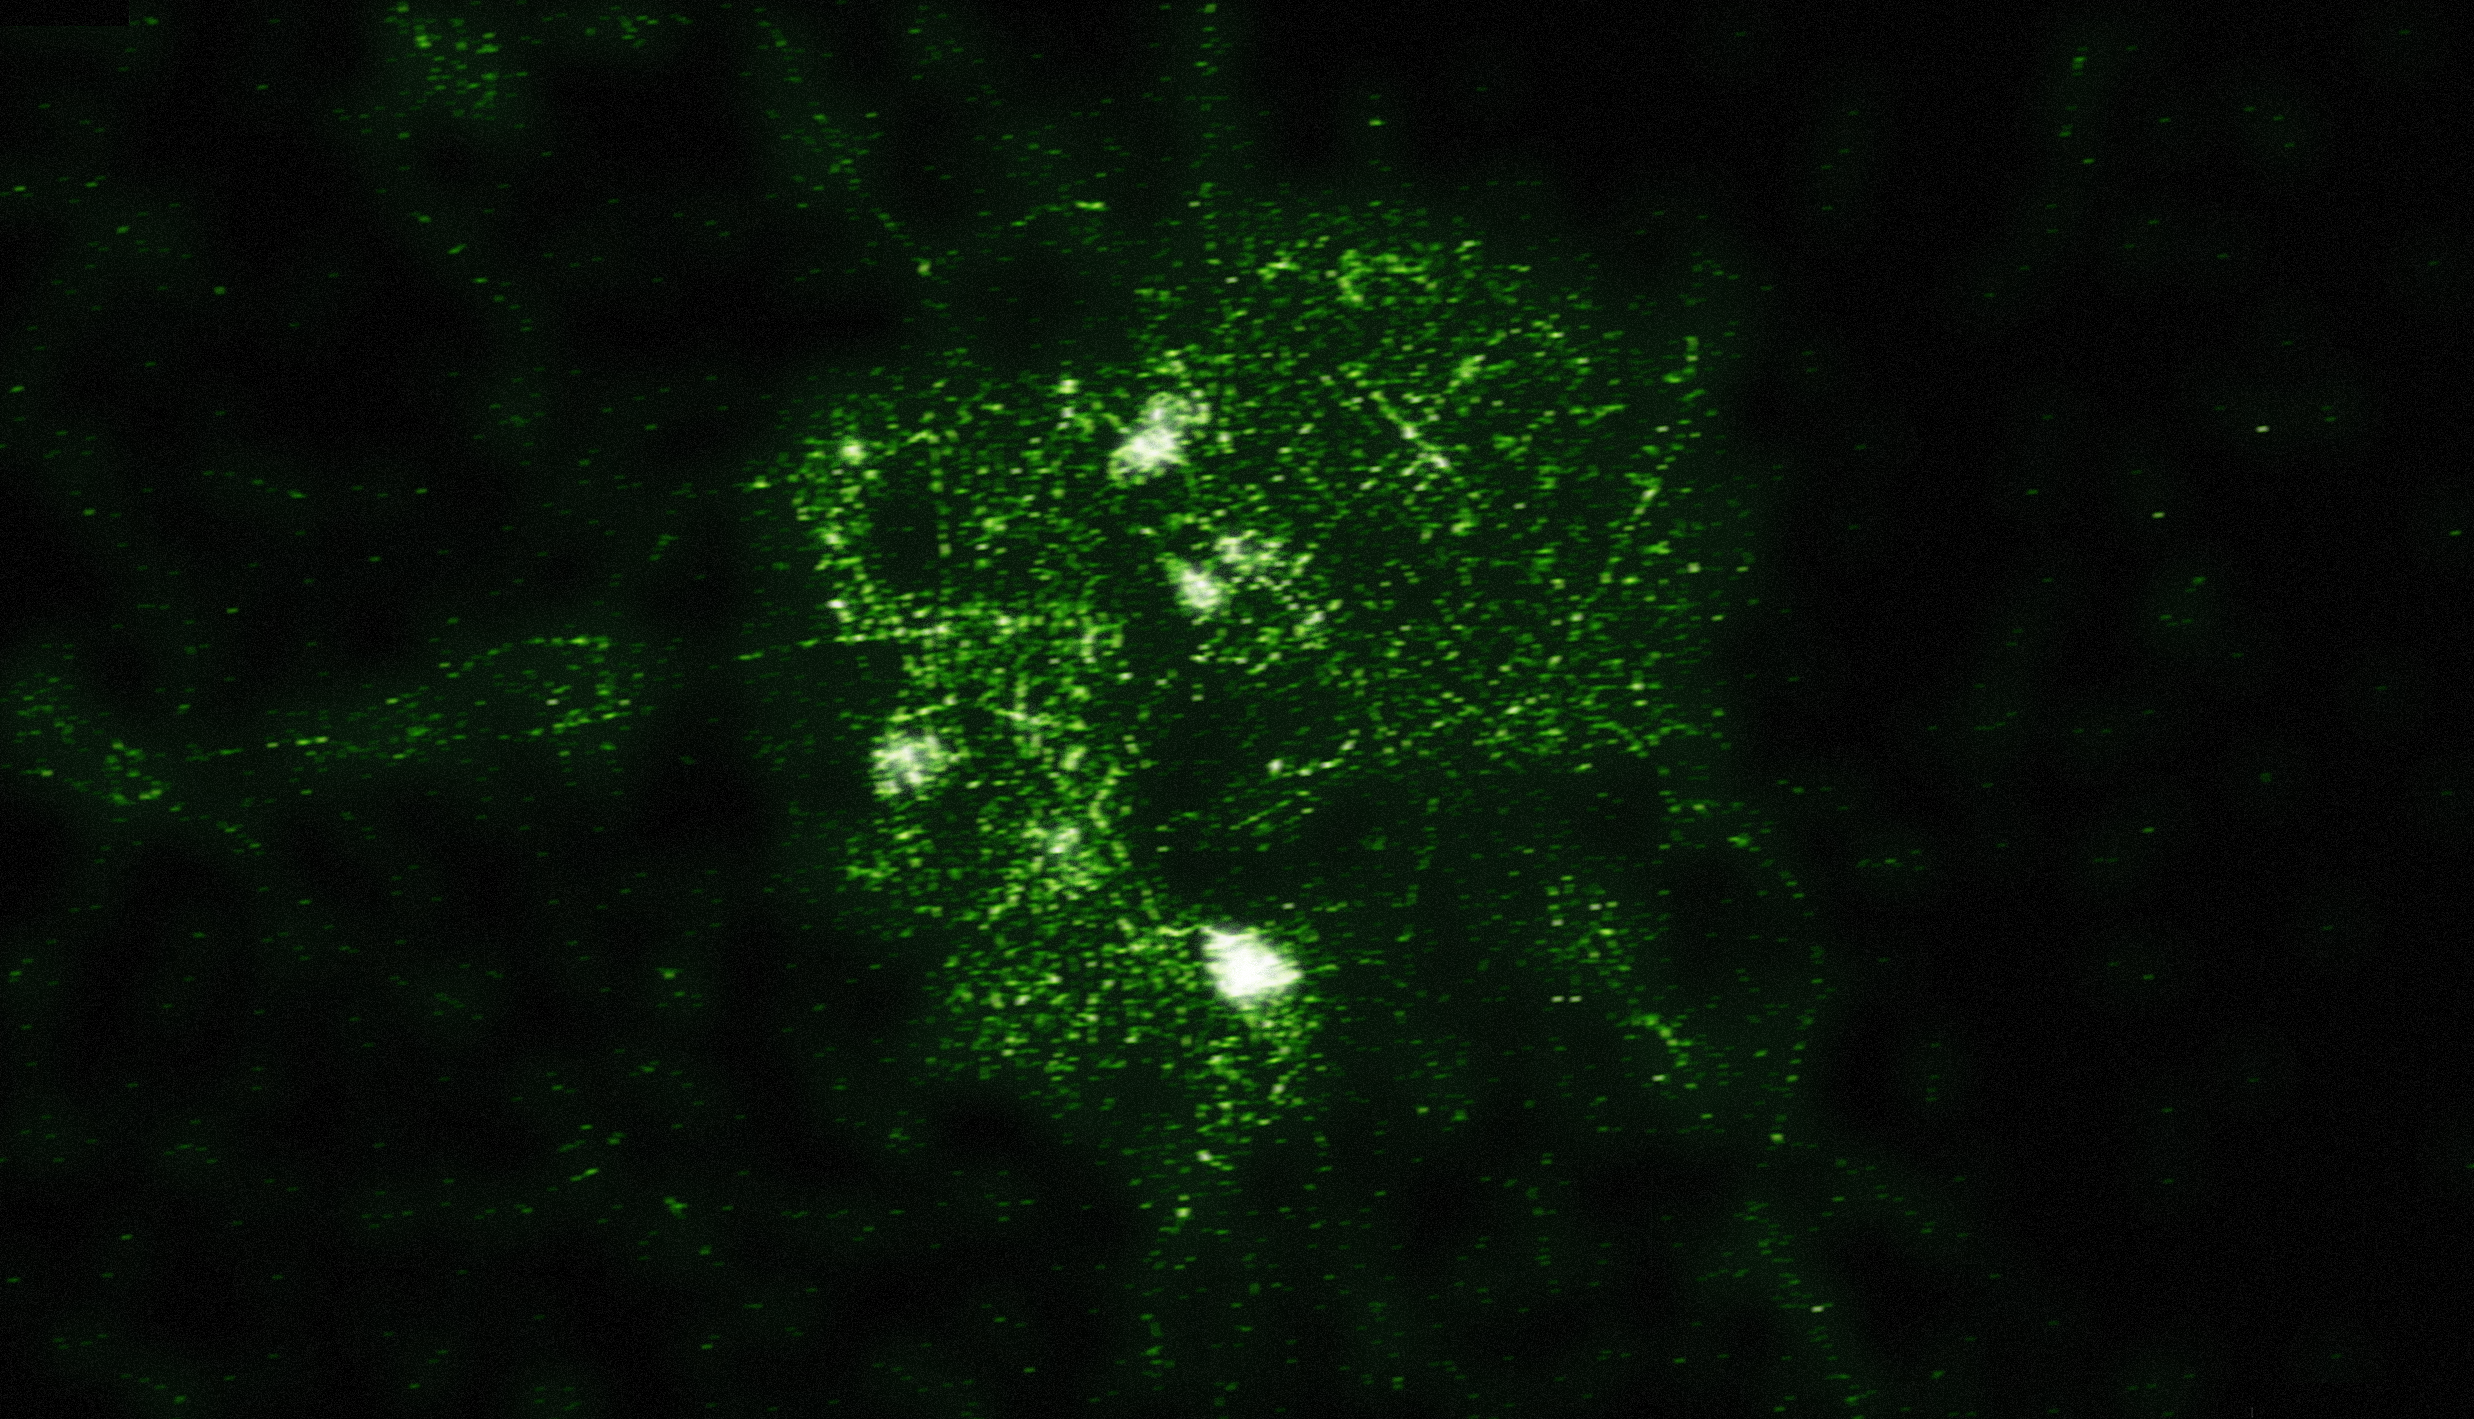
And finally just for fun, here’s a 3D rendering of the same 2 years of data:

It’s compelling data, and fairly easy to tell an interesting story. But is there an ethical issue around visualizing or using this data? There’s a lot that you can do with the data, obviously visualizations like this are just scratching the surface.
An idea that crosses the line
Following one train of thought to its logical conclusion leads me to a mobile app idea. It’s a simple app, essentially just a routing application. You type in where you’re going and you can get directions from your current location, just like any other mapping or GPS routing application. Except we can give you directions that avoid known DUI hotspots. In a very simplified sense, routing algorithms basically give streets a score, usually determined based on factors like speed limit, road size, distance, etc. The path with the lowest score wins, and that’s what you end up getting for your directions. All you’d have to do to route around common DUI locations is make the number of historical DUIs along a street segment count in the routing algorithm’s calculation. Streets with lots of historical DUIs would be avoided in favor of side streets with fewer arrests. You’d avoid Geary Blvd and intersections like 16th St and Mission St.
It’s an easy app and the data is there for the taking. I’ll leave aside the question of whether the idea would work in terms of being effective at making drunk drivers avoid actual arrest. For argument’s sake, let’s assume that it would work, or that some other similar type of app could. It’s not an app I’d build, and I assume pretty much everyone understands the moral objection.
I don’t have any big moral takeaway or conclusion. On the one hand there are arguments that data and knowledge can never inherently be bad. Then there are arguments that this particular data (or at least specifically a DUI-avoiding directions app) would only be used to encourage drunk driving. I’m not going to make the DUI-avoiding mobile app, that goes way too far down the path of encouraging bad behavior. But it brings up a lot of interesting questions we need to think about as we’re working with data like this.


