
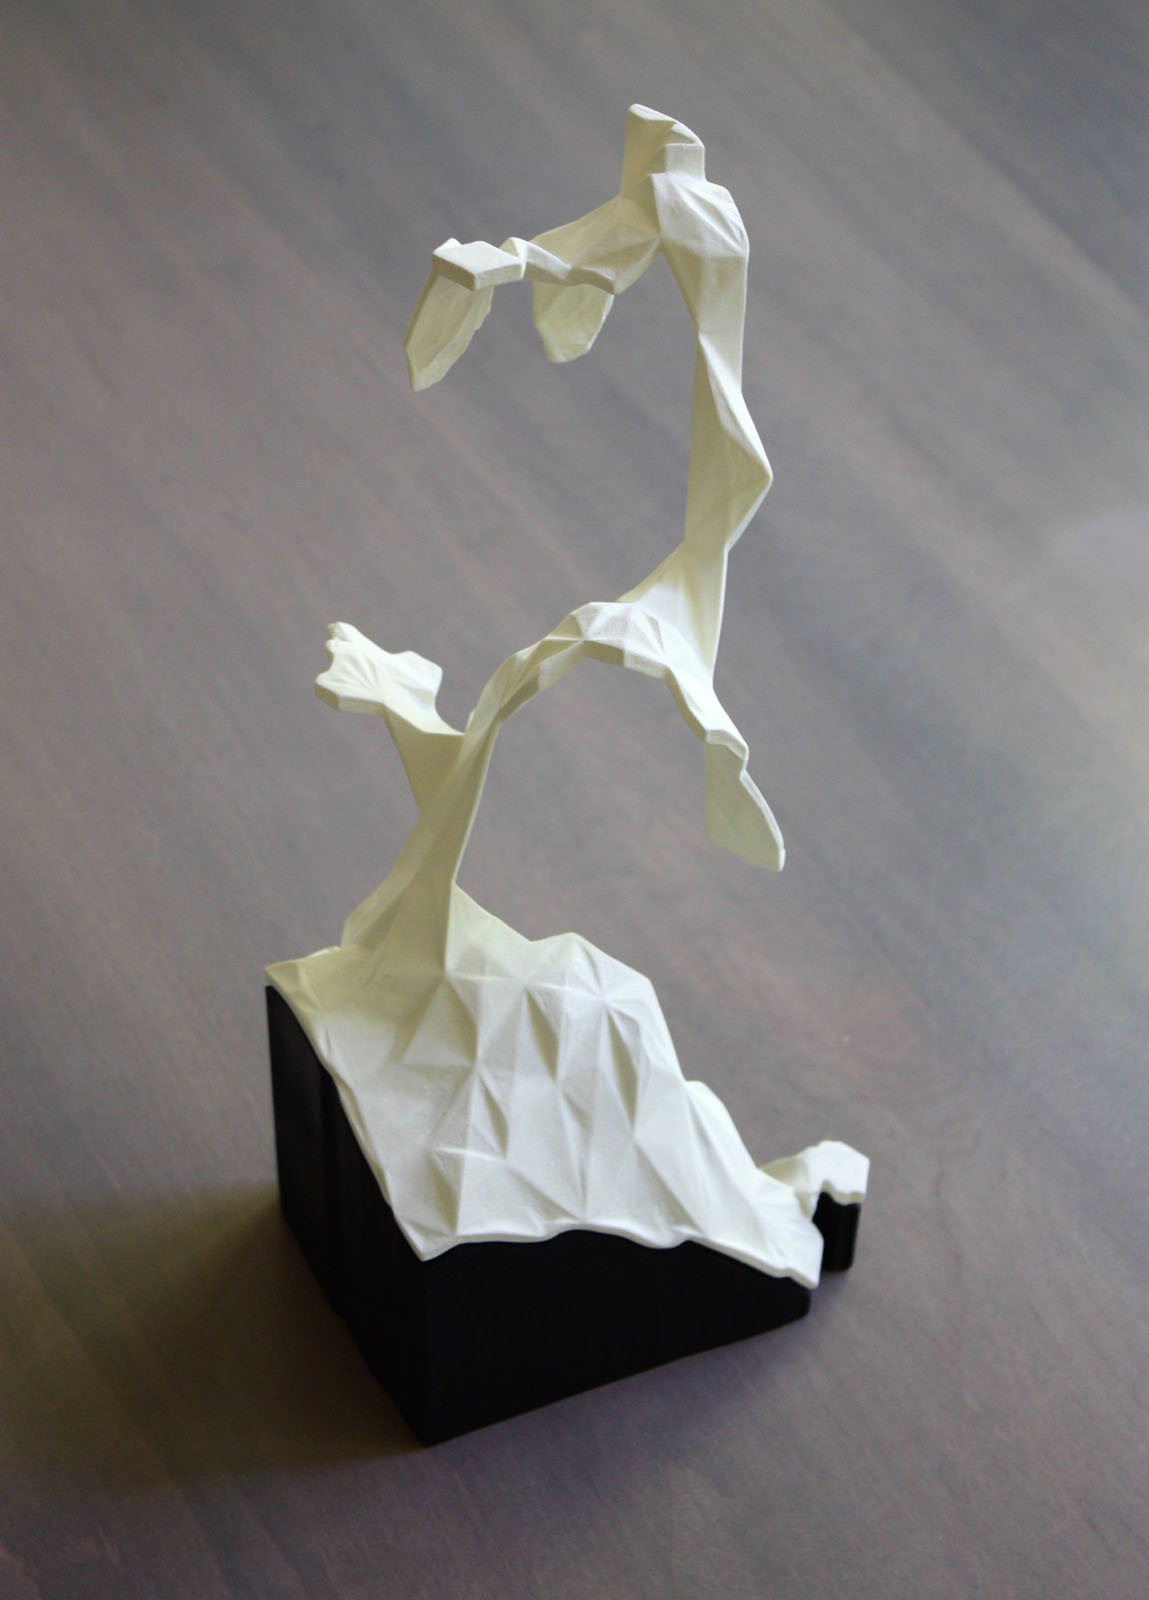
Large version of my sculpture of San Francisco housing prices.
This data sculpture depicts a map of housing prices in San Francisco. It’s a map of the city, torn at the seams. The height of each area represents the average price per square foot for recent home sales. Where neighboring areas are close in value they are connected, but if neighboring areas are too far from each other I allow them to split, tearing the city along its most severe economic divides. Data from 2016.
For more details see this writeup.


The large concrete base serves as a legend. The base is in chunks, with each chunk representing $100 per square foot. That allows you to see that the lowest-priced neighborhoods (data from 2016) start at about $500 per square foot.
