Data Visualization, Flex/Flash/Actionscript

Stalking Someone with Data

Data can often tell you far more about people than you originally think. In my previous post I presented some of the data from the history of the FlexCoders mailing list. I showed some of the details of the individual usage patterns for different people. One of those people was the Flex product manager, Matt Chotin. Matt’s involvement with FlexCoders is pretty interesting if you start to dig into the data. In this post I’ll try to identify some changing trends in his usage patterns and we’ll see if we can do some detective work to figure out why his behavior changed.

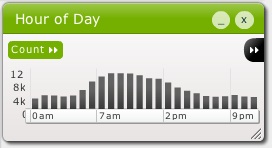
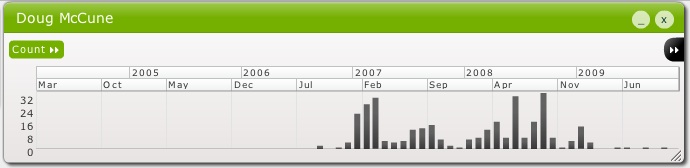
A little background: Matt has been involved in Flex since basically forever. He was an engineer at Macromedia and is now the product manager for Flex. Matt has been quite prolific on flexcoders over the years (in the overall ranking he’s #3). So to start I was interested in his overall post volume on the list. Take a look at the timeline showing his posts per month and you’ll notice there’s a distinct drop-off:

flexcoders_timeline_chotin

Here’s a closeup of a period:

flexcoders_chotin_drop

See that big drop from April to May of 2006? Well in May Matt changed jobs to become the product manager of Flex. On his blog he noted:

So if you notice the number of flexcoders posts going down it’s because my brain will be slowly atrophying as I move away from the details of our vast offering.

And that’s exactly what happened.

Daily routines

Seeing the correlation between a change in professional life and a drop in activity is cool, but we can dig deeper. Not only is this data telling us when Matt changed his behavior throughout the year, but we can also figure out something about his daily routines and how that changed as well. I started looking at when (as in what time of day) Matt was posting to the list.

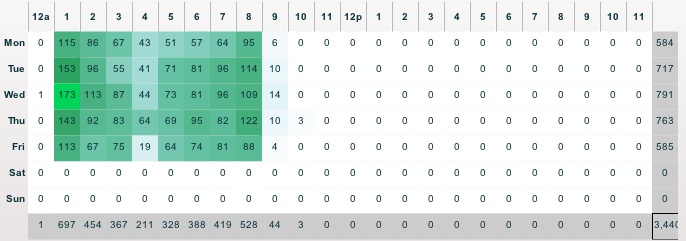
Here’s a chart that shows the distribution of posts by hour of day and day of week. It groups the posts by the combination of what day and what hour they occur on.

flexcoders_heatgrid_chotin

So you can see that Matt posted the most on weekday mornings (around 9-11am on Monday-Friday) and weekday evenings (around 8-10pm Monday-Thursday, note that he rarely posts on Friday nights).

This pattern is actually very similar to Alex Harui’s activity as well, although Alex’s activity is more weighted to during work hours than at night (except for Sunday night!).
flexcoders_harui_heatindex

I found the evening hotspots interesting (both in Matt and Alex’s cases). Clearly Matt was answering people’s questions a lot after work hours from home.

I dug a bit further into Matt’s trends. Here’s the graph of his activity by hour of day for 2005:

flexcoders_chotin_2005

We can see in 2005 he actually answered more questions in the evening than in the morning. Taking a look at 2006 this became even more pronounced, almost all his activity was at night (I wasn’t the only one who noticed this, see Ryan Stewart’s post about Matt posting at 9pm):

flexcoders_chotin_2006

And then there was a change in 2007. The graph for 2007 shows that he started answering more question during the workday. And that shift continued into 2008 and 2009, by which time almost all of Matt’s activity was during work hours.

flexcoders_chotin_2007flexcoders_chotin_2008flexcoders_chotin_2009

If you dig even deeper into the data you can find out that the transition from mainly evening activity to work-day activity happened mostly during the months of April 2007 – June 2007. After about July 2007 Matt almost primarily posts during the day. Taking a look at the release history of Flex, we see that the beta of Flex 3 came out in June 2007. So my guess is that Matt changed to a management role in May of 2006, but had far too much work to do to get Flex 3 ready and out the door between then and June 2007 (meaning his devotion to flexcoders had to be delegated to the evening hours). Finally once the Flex 3 beta was out the door he could devote some actual work hours to being involved in the community, instead of having to do it all from home.

Vacation Time

As if knowing the intimate details about Matt’s daily routine isn’t enough, we can learn something about his historical vacation time off as well. Matt’s impressive in that he’s never missed a month without posting. If you go even more granular there are actually very few weeks that he missed (as his overall activity declined in 2009 this became more common). So if we look at Matt’s activity around the holidays something interesting pops out (well, it’s only interesting if you’re a total stalker, but if you’ve read this far then you probably are). Here are a few timelines of different years, showing columns grouped by week. In 2005 we see Matt was posting pretty regularly through the holidays. There actually was a 5 day stretch with no posts, but that was it (due to the way the weeks are grouped that gap doesn’t show in this chart).
flexcoders_chotin_xmas2004

2005 is similar:
flexcoders_chotin_xmas2005

But then 2006 has a big gap:
flexcoders_chotin_xmas2006

And being the stalker that I am, I noticed that and then went to investigate further. Turns out Matt wrote about taking a vacation that year.

I’ll be on vacation until mid-January so emails to me will go unanswered as will responses to various forums and blog comments 🙂 Happy Holidays to all!

The data never lies.

Looks like a long vacation over the holidays didn’t turn into a regular thing though, since he was right back at it the following year:
flexcoders_chotin_xmas20071

I’m not a total nut job

I know it seems like I’m obsessed with Matt Chotin. And regardless of whether that’s true or not, I do want to assure people I’m not totally off my rocker. This little experiment in data mining and analysis isn’t really about Matt. It’s about the stories data tells about all of us. There are mountains of public information out there about us all, and the tiny little bits that we put out there, even if those are just little Facebook or Twitter status messages, can say a lot about us. Sure, a single Facebook status message doesn’t tell anyone much, but when you look at all of them over a multi-year period you can start learning a lot about a person. And often that information that the aggregate data tells about us isn’t something we’re aware of. From this data experiment I know when Matt eats dinner (pretty typical range of 6-8pm), when he goes to bed (around midnight), and when he gets to work (again pretty normal between 8-9). And this is all from only 4,000 data points. With social networking and microblogging sites we’re starting to create thousands of little data points like this all the time.

Thanks to Matt Chotin

I ran this post by Matt first, since I know it’s a bit creepy. He was cool with me posting it, so thanks Matt! And thanks for all the years of hard work answering questions on flexcoders, we’re a stronger community because of it.

The Data

Read more about the data here. This is 5 and a half years of mailing list activity, comprising about 148,826 individual email messages. Matt himself posted about 4,000 messages. You can download the full CSV dataset here.

Standard
Flex/Flash/Actionscript

FlexCoders Mailing List Stats, Pretty Graphs, Full Dataset

In this post I’m going to dive into details about the stats of the FlexCoders mailing list usage over the past 5 and a half years. It’s full of graphs of various fun statistics, like who’s most active on the list, when people post, and the overall traffic over time. It’s a bit of a trip down memory lane, and I apologize if I ramble, I like data and pretty pictures, and I have a soft spot in my heart for FlexCoders, so bear with me and hopefully for those of you on the mailing list it will be a fun trip.

Background

I’ve been on the FlexCoders mailing for a few years now (my first post was back in September 2006). As the Flex community grew, the list grew, some would say it grew to unmanageable levels. It’s certainly a lot of mail, I currently have 22,100 unread flexcoders emails in GMail. At one point we even debated furiously whether the list should be split up into multiple more focused lists, or if the whole thing was going to die. Regardless of that outcome the flexcoders list remained as it has been for years. One thing did change though: Adobe replaced their official forum (which was literally God’s worst forum software) with a new one. And the Adobe employees definitely seemed to be pushing people there, which isn’t to say they stopped answering flexcoders questions, but the community was certainly now split between two lists.

I subscribe to both flexcoders and the Adobe Flex forums (which you can setup to receive emails from). I started noticing a trend. Take a look at this picture of my inbox (only flexcoders and Adobe forums emails) as of right now:

flexcoders_flexforum

The orange label is used to tag the posts from flexcoders and the green label is posts from the Adobe forums. I started noticing that the number of posts from the forums were more than on flexcoders. That obviously made me wonder if the overall traffic on flexcoders was in decline. I’ve been inactive on the list for quite a while (been quiet for most of 2009). So I didn’t exactly have my finger on the pulse of flexcoders.

The Data

So I wanted to download the entire Yahoo group dataset to start playing with it. Turns out Yahoo doesn’t make this easy, but I found a sweet program called PG Offline that I used to pull down the entire list. It took me a few days to get all 148,826 messages (as of about 7pm tonight). But PG Offline worked incredibly well and I then had an Access database file with all the emails (it was about 1.5 gigs). I then used another program called MDB Converter to convert that to a text CSV file.

If you want to play with the data yourself you can download the CSV file (11 megs). It includes columns for the sender, date, and subject. I did not include the full-text of the emails, since that would make it a gig and a half.

Analyzing the Trends

I pulled the data into SpatialKey (which is what I work on for my day job) and started digging into the data. Here’s the report setup I created in SpatialKey to play around and filter down the data (click for a larger view):

flexcoders_report_sk

So we can start seeing the overall trend in the main timeline, which shows the rise and fall in traffic.
flexcoders_timeline

So there certainly has been a decline in traffic to the list. The most active month ever in the list’s history was March 2008 with 3,834 posts. And then it’s been a fairly steady decline since that peak.

Some other interesting high level stats are the hours of the most activity. This chart shows the number of posts by hour of day. Hour of day is Pacific time.

flexcoders_hourofday

You can clearly see the work-day hours there. 8, 9, and 10am are the most active, and then it slows down as the work-day finishes up (earlier for east coast people), and then there’s another small bump around 9pm in the evening.

Who’s Most Active?

Anyone who reads FlexCoders knows that Alex Harui (from Adobe) is the king. Here are two charts showing the top 10 posters of all time and the top 10 from just 2009.

flexcoders_top10_alltimeflexcoders_top10_2009

Alex certainly still holds the number one spot overall, but Tracy has him beat for this past year.

Diving into Individual Activity

It’s also pretty interesting to look at how different individuals use flexcoders, and how their usage has changed. Here are just a few selected people that I was curious about:

Alex wasn’t always the king. He had a few messages back in 2005, but his heavy involvement on the list actually started relatively late, in March of 2007 (which is also when he started blogging coincidentally).
flexcoders_timeline_harui

Tracy Spratt, on the other hand, has been on the list since its very beginning:
flexcoders_timeline_spratt

Matt Chotin (Flex product manager) has also been active since the list started:
flexcoders_timeline_chotin

Actually, Matt Chotin and Tracy Spratt are the only two people who have posted to the list at least once every single month since the very beginning (from April 2004 to now). They get the FlexCoders Lifetime Achievement Award!

Some people were around in the early days but then dropped out. Here’s Jesse Warden‘s activity:
flexcoders_timeline_warden

Some people get sucked into the list fast and then fizzle out. Josh McDonald was the third most prolific poster of 2008, but then stopped posting as quickly as he started:
flexcoders_timeline_mcdonald

And some people stop posting when it’s no longer part of their job, like Roger Gonzalez who worked for Adobe and left in March 2007 (which was also the last time he posted to the list):
flexcoders_timeline_gonzalez

Ely Greenfield (Principal Architect at Adobe working on Flex 4) used to be fairly active back in 2006/2007, but hasn’t said a word in the past two years:
flexcoders_timeline_greenfield

And what about me? I was fairly active on the list from about 2007 through the beginning of 2009, then pretty much radio silence:
flexcoders_timeline_mccune

And some people don’t live in the USA and post at completely different times. Here’s Tom Chiverton‘s (4th most prolific poster of all time) usage pattern by hour of day and day of week. It groups the posts by the combination of what day and what hour they occur on.
flexcoders_heatgrid_chiverton

At first glance it looks like Tom emails the list in the middle of the night, until you realize that he lives in England 🙂

I’ve had a lot of fun drilling into the history of this list. It’s really cool what kinds of trends you can find (probably another post in more detail on that later).

Want to play with the data?

You can download the complete CSV file and use it if you want. I’d love to see people turn it into much more interesting visualizations. This dataset goes up until November 2 2009. Since it’s a bit of a pain to keep it updated I probably won’t update it very often, but if there is interest I might do so once a month or so.

Notes on privacy

All this data is public, you can see it all by going to the Yahoo group and searching. There are no email addresses in this data (unless perhaps if someone used their email address as their name as well). Any names in this data are there because the person knowingly emailed the public flexcoders email list. This CSV download is obviously a much easier format to work with all the data, and it can certainly be mined for interesting trends. I just ask that people play nice with the data. We’re a community, and this is data that represents our lives (or at least one small sliver of our lives) for the past 5 years.

Standard
Flex/Flash/Actionscript

Some flexcoders stats

I’ve recently compiled a fairly complete database of all the messages ever sent to the flexcoders mailing list. I’ll be posting the sqlite database file that you can load into your own AIR applications to start playing with this data. But before anything else I thought I’d post a few fun tidbits:

Top 10 Posters

Poster # Messages # unique threads
Alex Harui 3259 2172
Matt Chotin 2793 2153
Tracy Spratt 2522 1886
Tom Chiverton 2368 1559
Manish Jethani 1296 1004
Gordon Smith 1371 978
JesterXL 1216 702
Abdul Qabiz 833 614
Michael Scmalle 904 513
Tim Hoff 798 470

Longest Threads

Subject # Messages # unique posters
Splitting FlexCoders into smaller, focused groups 130 28
Will Microsoft’s Silverlight Player Kill our beloved Flex? 127 48
Flex 1.5 price 102 36

[DISCLAIMER: I have not verified this data at all. For all I know I fucked something up in the scraping process and it’s all whack. Who knows.]

Method for gathering data
I wrote an AIR application that scrapes the mail archive site for a specific group. This pulled all the messages that are available on the flexcoders archive of mail archive. (to get this listing I did a search that encompasses the entire date range I wanted to get paged results for all the messages). Unfortunately I can only get pages of 10 messages at a time from the mail archive. And there are over 96,000 messages in the flexcoders archive. And I didn’t want to hammer the site to total death and wanted to respect the request to not request more than one page a second that’s in the mail archive FAQ. So how long does downloading 96,579 messages take if you download 10 at a time once a second? About 3 hours more or less.

Oh, and it turns out that the HTML in the mail archive pages isn’t valid XHTML, so parsing it can be a bit of a bitch. So I managed to get about 20,000 messages in when I ran into a parsing error that halted the whole process. After about 3 different tries I finally got all the way through.

[DISCLAIMER 2: The mail archive site lists something like 96,000 messages for flexcoders, but the yahoo group seems to have quite a bit more, more like 116,000. Why the 22k difference? I don’t know. Something’s whack, but I’m guessing that what I got is not the full 100% complete version of the messages. But hey, it’s the best I got right now.]


Why the hell?

We recently had a long discussion on flexcoders about whether or not the list should be split into multiple smaller lists. Notice the longest thread of all time in all of flexcoders history? Yeah, it’s that thread. So we debated back and forth and everyone seemed to have their own opinion. There were some assertions made about the stats of the list in terms fo # of people posting and losing previous subscribers. So I decided to get a database of all messages so I could try to figure some of that stuff out. So gathering the data was step 1. Now step 2 is using the data to try to figure out if people are in fact dropping off the list, and whatever other interesting tidbits I can glean out of it. I figure it’s a good way to play with some data visualization techniques.

What’s next with the data?
I’m going to post the sqlite DB file for anyone to download. The complete DB file is 90 megs. I’m also thinking about removing the “excerpt” column (which contains the first part of the complete message) because I assume that will drop the size considerably. I’m going to figure out whether I just want to post the 90 meg thing on my website or if I want to try to offload that somewhere, although I imagine there are only a few people who wpould be interested in downloading this thing anyway 😛

I’m also going to play with doing some visualizations of this data now that I have it in an AIR app. I’ll probably just take screenshots of what I come up with, seeing as to actually run this stuff you’d have to download a frickin 90 meg air file, which seems a little excessive. Or maybe I’ll give people a 90 meg AIR app, fuck it right?

I hope to post the sqlite database file over the weekend. Then as I have time I might start playing with the data and posting my results.

Standard