
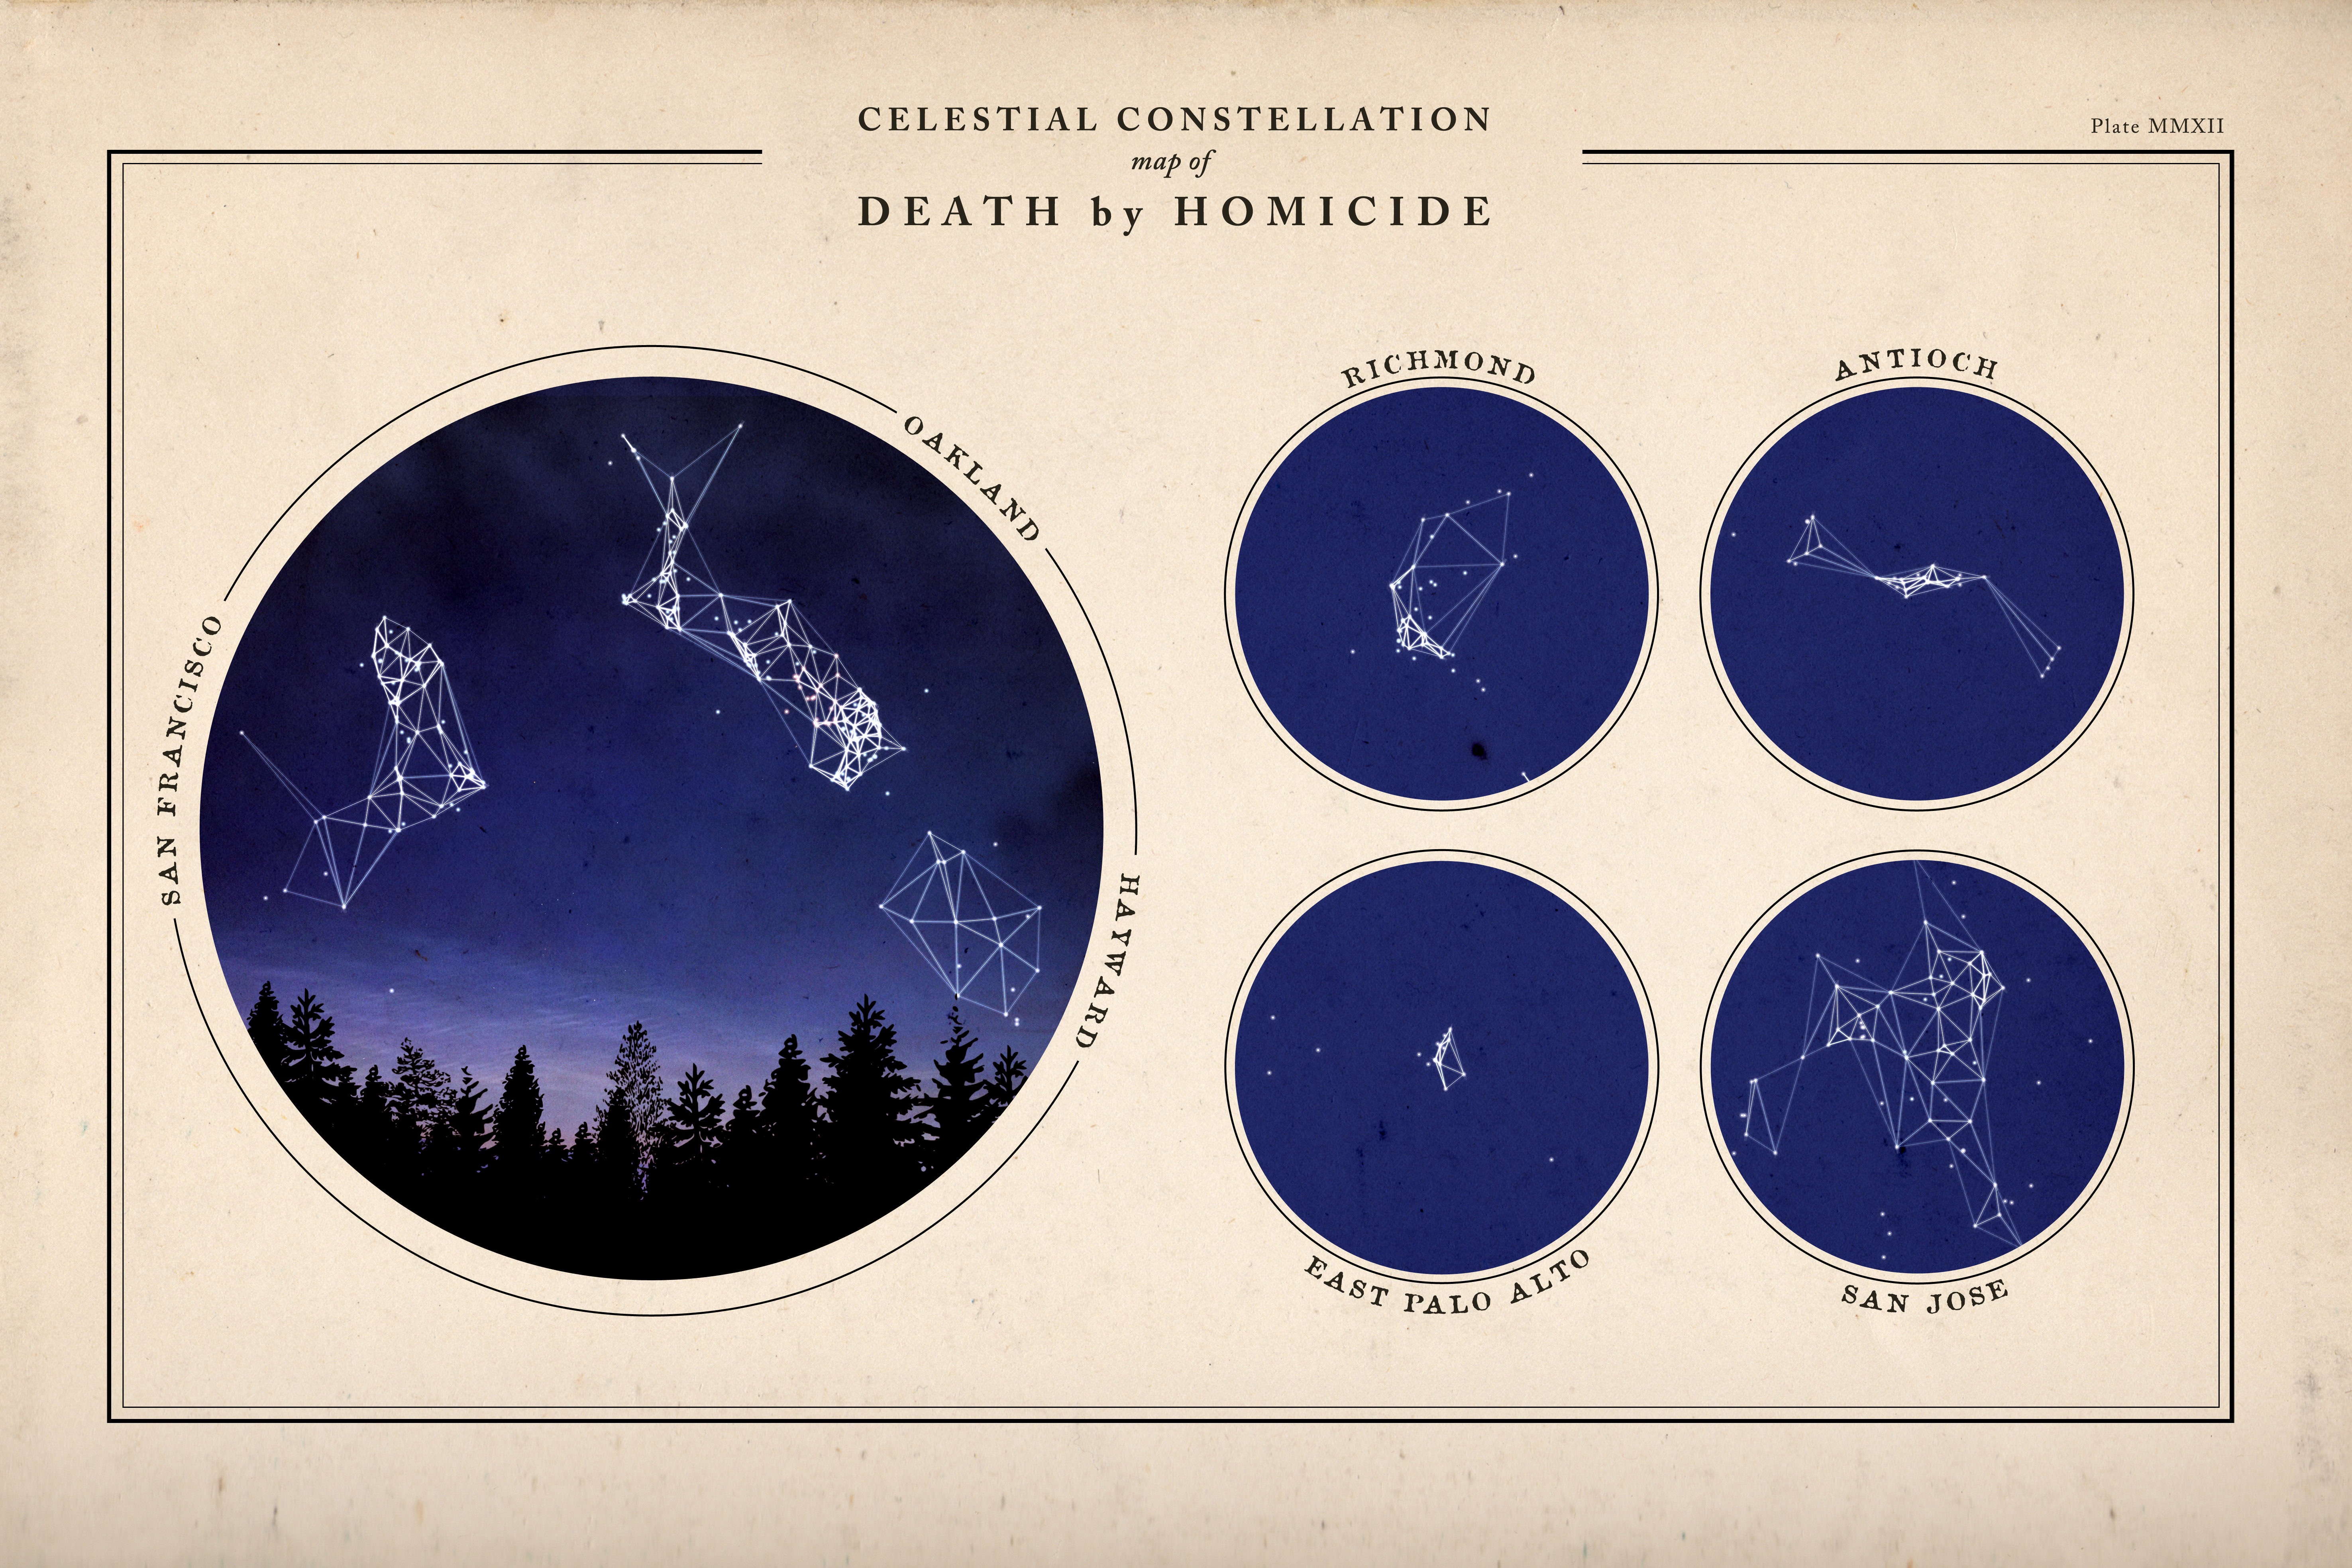
This is a map of murders throughout the Bay Area. Constellations are formed by connecting homicides from 2013 that are in close geographic proximity to each other. Homicides from 2014 are also layered on to provide a bit more context, although not used to form the constellations.

“Perhaps they are not stars, but rather openings in heaven where the love of our lost ones pours through and shines down upon us to let us know they are happy.”
Eskimo Proverb
Detailed Views
Here’s a detailed view of San Francisco and Oakland, which have some of the most interesting constellations. As with clouds in the sky, different people will see different things. San Francisco jumps out as a dog to me. In Oakland I can see a whale or shark (facing south toward Hayward) or a caterpillar (facing north toward Berkeley).

Just north of Berkeley we have a cluster in Richmond, forming what to me resembles a child swinging in a hammock.

A bit to the east is Antioch and Pleasanton. Antioch is the main cluster in the middle and Pleasanton is the smaller cluster to the west.

East Palo Alto is a notable cluster that stands out due to its concentration and isolation. The data has eight 2013 murders in East Palo Alto, contrasted with almost nothing in the richer surrounding cities of Palo Alto, Atherton, and Menlo Park.

The sprawling city of San Jose also produces a sprawling map — connecting the dots of the 2013 killings produces a disarming image that looks an awful lot like a human face.

The Data
San Francisco publishes a decent amount of crime data on its data portal, DataSF, however homicide data is not included. The data used in these maps was collected and published by the San Jose Mercury News.
Method
Both the 2013 points and the 2014 points were used in the map. To form the constellations, however, only the full set of 2013 data was used. Constellations were formed by connecting the 2013 points using Delaunay triangulation and then filtering down the resulting lines to only include lines shorter than a certain distance. That left clusters of points that are all close together.
Here’s the map of only 2013 points connected using Delaunay triangulation.

There is no connection between any of these locations besides their proximity to each other. A line connecting two points is not meant to signify any relationship (again, other than their geographic proximity).
Tools
The data was processed using QGIS for the initial exploration work and to create the Delaunay triangulation lines. I then brought the data into MapBox Studio, which was used to style the points and lines and to export a high resolution image. The rest of the processing was done in Photoshop.
High Resolution Files
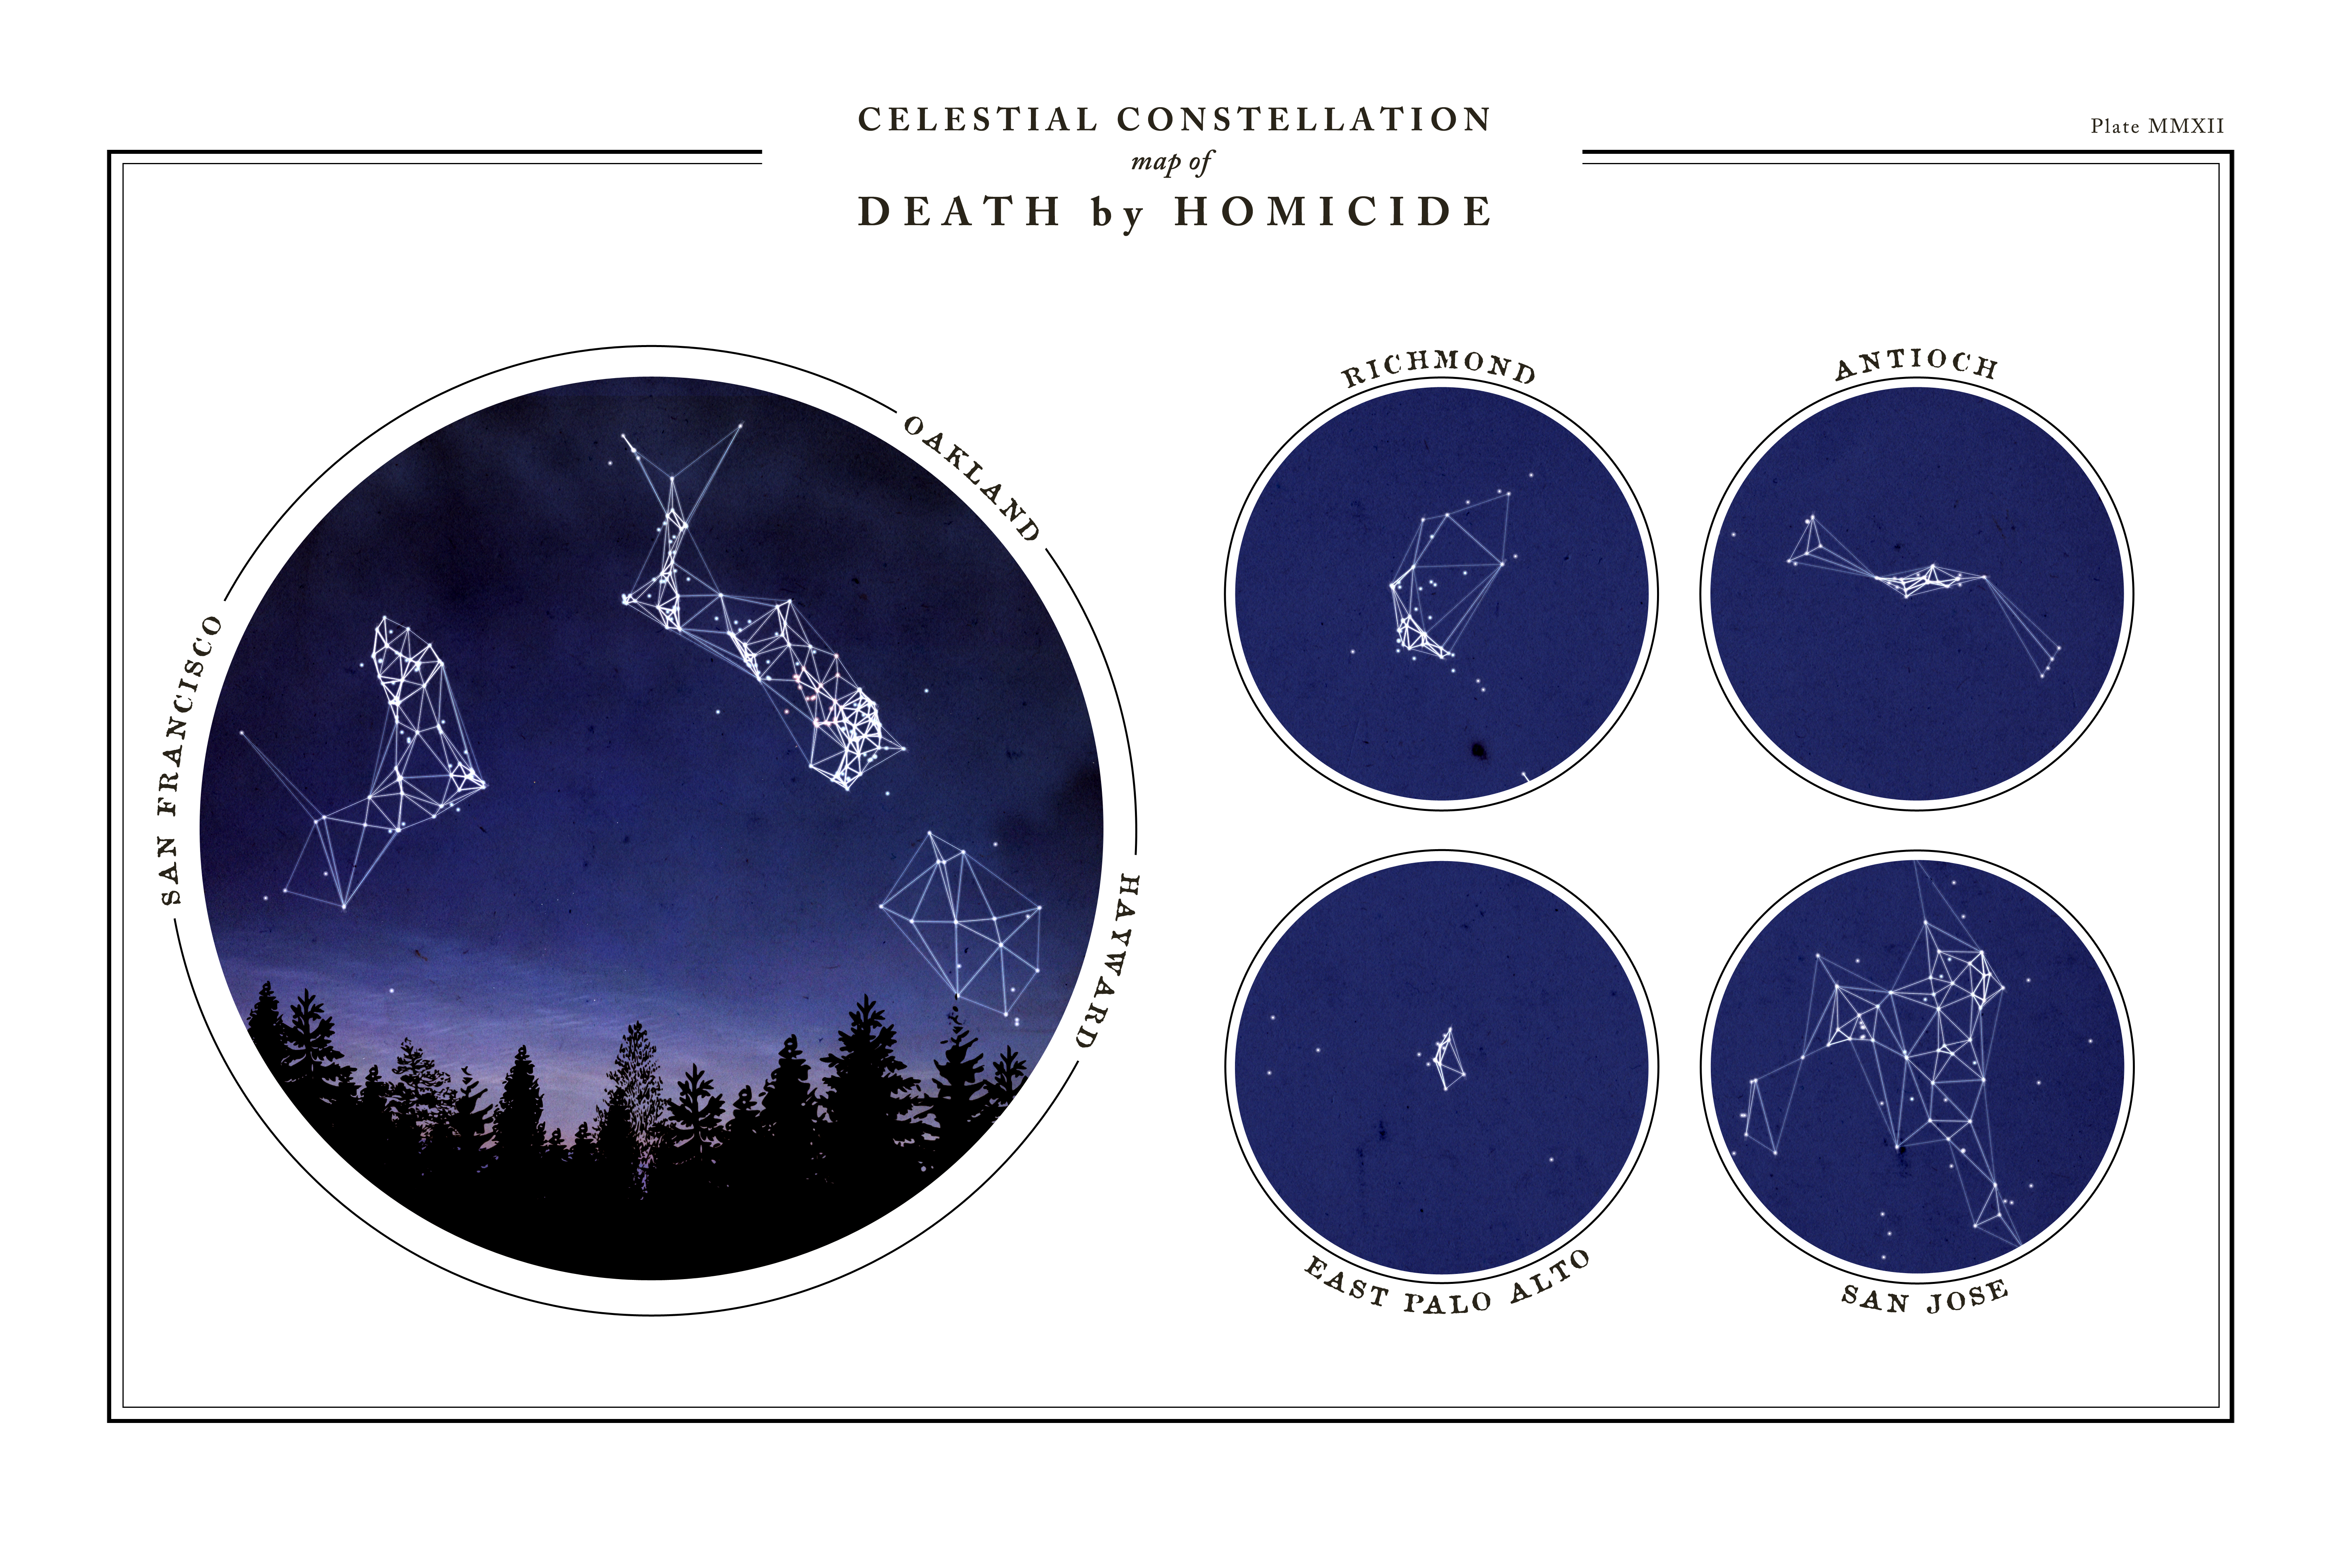
All images are licensed under the CC BY-NC 2.0 license. If you’d like to print your own copy the dimensions should work with an 18×12 print.
High-res version with the “old paper” background (32 MB)
High-res version with a white background (12 MB)
Looks great!