Art, Maps, SpatialKey

Night Vision Maps of the WikiLeaks Iraq Casualty Data


In 1990 I was an eight year-old kid. And like most eight year-olds I spent a lot of time in front of my TV. But the summer of 1990 was different. Instead of cartoons I was watching the first Gulf War.

The television media coverage of the war was everywhere. Except these weren’t the gruesome images of the Vietnam era. These were images that looked more like videogames. We had cameras attached to bombs that used night vision and targeting scopes as they dove into buildings. All the images were a bit fuzzy, a bit grainy, either tones of gray or green, and overall void of emotion.

But we were watching people die.

The disconnect between the emotionless images shown on TV and the reality that they represented has always stuck with me. The fact that we could (and still do) present something so horrible in such a clinical, disconnected way makes my head spin.

WikiLeaks Iraq data

I’ve been experimenting with mapping the recently released data from WIkileaks that documents deaths in Iraq. All told the data documents 108,365 deaths, which we assume are just a fraction of the true casualty count from this war. Of those deaths, 65,641 were civilians.

I’ve used SpatialKey to produce some heatmaps of these deaths by recreating the aesthetic of the night vision images we’ve grown so used to seeing. I downloaded the data from the compiled spreadsheet published by the Guardian. Each image has a high resolution version available (2,474 pixels by 1,419 pixels).

A view of the entire country


High resolution version

A closer look at the area of Baghdad


High resolution version

More details of Baghdad


High resolution version

Why?

These images are meant to be a bit provocative. Every tiny blurred dot represents someone dying. And yet it’s all presented in a way that everyone is comfortable with. When you glance at these images you don’t immediately think of killing. We’re so used to seeing emotionless, blurry images of rockets exploding and precision bombs targeting buildings that we disconnect the image from the reality. These are images of death. And the fact that we’re comfortable looking at them should give us pause.

Standard
Art, Data Visualization, Maps

If San Francisco Crime were Elevation

I’ve been playing with different ways of representing data (see my previous night lights example) and I decided to venture into 3D representations. I’ve used a full year of crime data for San Francisco from 2009 to create these maps. The full dataset can be download from the city’s DataSF website.

A view from above

This view shows different types of crime in San Francisco viewed directly from above. The sun is shining from the east, as it would during sunrise.

top_500

I love how some of the features in these maps are pretty consistent across all the crime types, like the mountain ridge along Mission St., and how some of the features only crop up in one or two of the maps. The most unique map by far is the one for prostitution (more on that further down).

An alternate view

Here’s the same data but from a different angle, which helps show some of the differences.

UPDATE: Whoops, I screwed up originally and had a duplicate image. The original graphic showed the same map for Vandalism and Assault (both were the Vandalism map). This updated graphic has the correct map for Assault.

right_500_2

Many of the maps have peaks in the Tenderloin, which is that high area sort of in the north-east center area of the city. Some are extremely concentrated (narcotics) and some are far more spread out (vehicle theft).

My favorite map is the one for prostitution (maybe “favorite” is the wrong choice of words there). Nearly all the arrests for prostitution in San Francisco occur along what I’m calling the “Mission Mountain Ridge”, which runs up Mission St between 24th and 16th.

EDIT: I’ve been corrected. Upon closer inspection the prostitution arrests are peaking on Shotwell St. at the intersections of 19th and 17th. I’m sure the number of colorful euphemisms you can come up with that include the words “shot” and “well” are endless.

I love the way the mountain range casts a shadow over much of the city. There’s also a second peak in the Tenderloin (which I’m dubbing Mt. Loin).

prostitution_500

Drug crimes are also interesting to look at, since so much of the drug activity in San Francisco is centered in a few distinct areas. We can see Mt. Loin rising high above all the other small peaks. The second highest peak is the 16th St. BART peak.

drugs_500

There are other consistent features in these maps, in addition to Mt. Loin and the Mission Range. There’s a valley that separates the peaks in the Mission and the peaks in the Tenderloin, which is where the freeway runs (Valley 101). You’ll also notice a division in many of the maps that separates the southeast corner. That’s the Hunter’s Point Riverbed (aka the 280 freeway).

Disclaimer

These maps were generated from real data, but please don’t take them as being accurate. The data was aggregated geographically and artistically rendered. This is meant more as an art piece than an informative visualization.

Standard
Maps, SpatialKey

New SpatialKey Crime Example for San Francisco

We just posted a new example of using SpatialKey to visualize crime in San Francisco. We load in 90 days of crime data from the city, then filter down to only include sales of heroin, crack cocaine, and methamphetamine within 1,000 feet of a school. Why those particular crimes around schools? The SFPD just launched a new initiative called “Operation Safe Schools” that specifically targets these drug crimes. If you’re caught dealing crack, heroin, or meth around a school while the school is in session you can get extra prison time.

Check out the video below and read the full article on the SpatialKey blog.

Read the whole article on the SpatialKey blog to see how we put this together and learn more about the SFPD’s “Operation Safe Schools.” You can also watch the full resolution video on YouTube

Standard
Flex/Flash/Actionscript, Maps, SpatialKey

Drinking at 10am and geeking out on SpatialKey and Flex

James Ward and Jon Rose just published the latest episode of Drunk on Software that features members of the SpatialKey team, including myself, Tom Link (CTO of Universal Mind), and Brandon Purcell (Director of Technology for UM).

As a brief disclaimer in case I slur any words near the end: I was in Denver for a short trip and we squeezed in a time to meet with Jon and James right before I had to head to the airport to fly home. The only problem was that we had to meet at about 10am in the morning. And since the show is called Drunk on Software we obviously had to be drinking. So by the time I got on my flight I was probably 6 beers down 🙂

A big thanks to Jon and James for making the time to have us over (that’s the living room of Jon’s house). And thanks for the beer guys!

Standard
Maps, SpatialKey

Announcing SpatialKey – Geographic Information Without Limits

SpatialKey LogoToday I’m proud to announce the launch of SpatialKey, the geospatial information visualization product I’ve been working on with our fantastic team at Universal Mind. I’ll make a bold statement that I stick by: this is the best web-based mapping product in existence. Today we’re releasing a “technology preview” that gives you a little glimpse at what we’ve been working on (just to whet your appetite until we release the full product).

Quick links
Before I explain what SpatialKey is I wanted to give a few quick links because I know a lot of you are going to have your ADD act up before you read the rest of the post.

  • SpatialKey Gallery – lists a few dataset/template pairs that we think tell great stories. Read the descriptions of the datasets and then launch the app to play with the data yourself.
  • screenshot067.jpg
    San Antonio Prostitution hotspots

    San Antonio Prostitution Crimes – This link will jump you straight into exploring the prostitution crimes in San Antonio from Jan 2006 – July 2007. Check out how clearly the heatmap points out the corners that are the hotspots in the city.

  • Growth of Walmart – This link will load the Walmart dataset into a playback template that lets you click play and watch Walmart take over America.


Beyond points on a map

screenshot068.jpg
Overwhelmed with markers

We’ve been seeing the same tired approach to web-based mapping for years now. Everyone throws markers on a map. You want to track crime? Throw a bunch of markers on a map. Little pin markers work fine if you’re showing a few data points. Want to see the location of Starbucks within a 3 block radius of your house? Use markers. But what if you want to see the total sales of all Starbucks worldwide? Or all crimes for the past 10 years? For the whole country?

SpatialKey uses some of the most advanced visualization renderings for geospatial data that have ever been seen on the web. The focus here is on aggregate renderings: heatmaps, thematic grids, graduated circles. 1,000 markers all piled on top of each other doesn’t help anyone. What you want to see is density or sum total value. SpatialKey focuses on rendering aggregate data in meaningful ways. We can show you a heatmap of the entire country and let you visualize any number of data fields. You want to see the heatmap represent total sales of all stores in the region? No problem. You want to see average house price over the past 10 years? We can do that.

Heat Map Heat Grid
SpatialKey Heat Maps SpatialKey Heat Grids

We haven’t seen innovative technology in this industry since Google let you drag the map. (I actually vividly remember that moment when I first dragged a Google map and my mouth started to water). It’s time to move beyond points on a map.

Your data doesn’t have limits
Try adding 10,000 data points to a Google Map. I dare you. What happens? If you’re using the “My Maps” feature of Google Maps, you’re limited to only show 200 points at a time, then you have to page through your data. And to top it all off you’re limited to a whopping total of 1,000 data points in the entire data set. So you get to page through 5 pages of data and only see 1/10th of your total data set anyway. If you create your own application with the Google Maps AJAX API you’re going to have serious performance problems when you get up into a few hundred markers. We think that’s ridiculous.

SpatialKey breaks through the limits of previous mapping technology in two ways. First, we’re simply faster. Flash can process and render data far faster than JavaScript. We can render 10,000 data points in a matter of milliseconds. You simply can’t do that with any JavaScript API out there. Second, we’re smarter. We aggregate data to produce heatmaps instead of just trying to overlay markers one on top of the other. Fundamentally, a massive dataset is an information visualization problem, not a technical one. You need better renderings to convey massive amounts of data, and that’s what SpatialKey delivers.

This is just the beginning
This is a technology preview. That basically means we’re showing you some cool stuff, but we’ve got way more up our sleeve. We’re looking for feedback on what we’ve got, and we’re hoping to get you excited about what we’ll be rolling out. We’ll be releasing new versions of SpatialKey Personal that will let you easily import your own data (if you’ve got an Excel file with addresses you can drop it right in). We’re also going to be releasing SpatialKey Enterprise, which lets you load a data set of any size (millions and millions of points). And then we’ve got a third product that we’re launching called SpatialKey Law Enforcement Dashboard, which is an enterprise version of SpatialKey specifically targeted toward police departments (includes special law enforcement reporting templates). And in the meantime we’ll be rolling out some more example datasets for you to play with, so keep an eye on the SpatialKey blog.

So go check out the SpatialKey Gallery and play with some data. We’re looking for feedback during this phase, so if you have any suggestions or (god forbid!) you run across bugs, please let us know by emailing feedback@spatialkey.com.

Standard
Maps

Tracking my location – forever

I have recently started tracking my geographic location, with the intent of keeping an automatic log of where I am, ideally for the rest of my life. I have no idea how long I’ll realistically be able to keep this updated, but I figure “forever” sounds like a good goal.

Method
firefoxscreensnapz011.pngI just got my very first Blackberry (the Curve), which has built-in GPS. The first thing I wanted to figure out (after getting gmail on the phone) was how to store position reports automatically. There are a few pieces of software that sort of do this, although some applications store the position logs locally on the SD memory card, which you then download to your computer. There are also some subscription-based services catered more toward enterprise-level fleet management that do way more than I need (TeleNav Track, Accutracking) . The SD card approach is no good for me. I’m lazy, and I know there’s no way I’m ever going to transfer the position log from my phone to my computer. The subscription service is a bit more realistic (Accutracking even has a REST API), but I’m not excited about having to keep a subscription paid and active and rely on someone else for my reports. The only real workable solution was to find an application that automatically sent the position information to a web server, and ideally to my own webserver so I can have full control over the data.

firefoxscreensnapz012.pngEnter Mologogo. Mologogo is a free application and service for GPS-enabled phones that does exactly what I wanted. It runs automatically every few minutes (mine’s set to run every 5 minutes) and sends your position report to the Mologogo online service, which keeps track of your points. That’s halfway to what I needed. The icing on the cake is that the Mologogo application has an awesome feature that lets you set your own URL that the service will also send the position report to. Bingo. This lets you save your position reports in your own database to do whatever you want. I grabbed some of the sample PHP code from the Mologogo wiki and installed it on my personal web server. After configuring the Mologogo Blackberry app I was getting position reports logged in my database.

Why?
This is not about showing where I am in real-time. This is not about “life-streaming” or “life casting” or whatever the current buzzwords are for letting strangers watch every moment of your life. I do not plan on showing my current location on my blog, or letting people see exactly where I am as I’m there. I’m not going to do that for a few reasons, and privacy is one of them I guess, although I’m not really freaked out about the idea of having my current location be public knowledge. The main reason is that I think that stuff is boring as hell. I watched Justin.tv for all of about 5 minutes, and the entire draw of that kind of lifecasting is the hope that the person you’re watching is going to do something stupid, which usually happens specifically because they’re living to entertain their audience. Other people (in fact most of the people who use Mologogo I assume) like the concept of simply letting people see their latest position reports. But why? I don’t find the idea of viewing where some random guy (or even a good friend) is at the current instant compelling. I suppose if all my friends automatically told me where they were that could be kind of cool and helpful for meeting up. But whatever, that’s semi-useful and still boring.

This is about analyzing historical data. It’s about the visualization of years, the visualization of decades. It’s about being able to see the geographic context of my life. I probably won’t do anything with this data for a year or two. It only becomes truly valuable after extended periods of time.

To try to think about how much data we’re talking about here’s the approximate math:

1 report every 5 minutes = 12 reports an hour = 288 reports a day = 105,120 reports a year = 1 million reports a decade

So theoretically let’s say I can somehow figure out how to actually do this constantly until I’m 80 years old. That would be about 5 and a half million records that would catalog my movement around the world for most of my life. That amount of data is already easy to store online. I can store millions of records like this in an inexpensive hosted database, ideally duplicated in multiple locations for redundancy. So the challenge isn’t about how to store the data, it’s about what to do with it, and that’s where it starts to get fun.

Visualizing the geospatial context of life
The important things in your life have a geographic context. Moving to a new city, changing jobs (even if that just means a slightly different commute), traveling on vacation, etc etc. The geographic movements of your life are directly tied to meaningful experiences. Being able to visualize those movements is like having a picture of a certain time of your life.

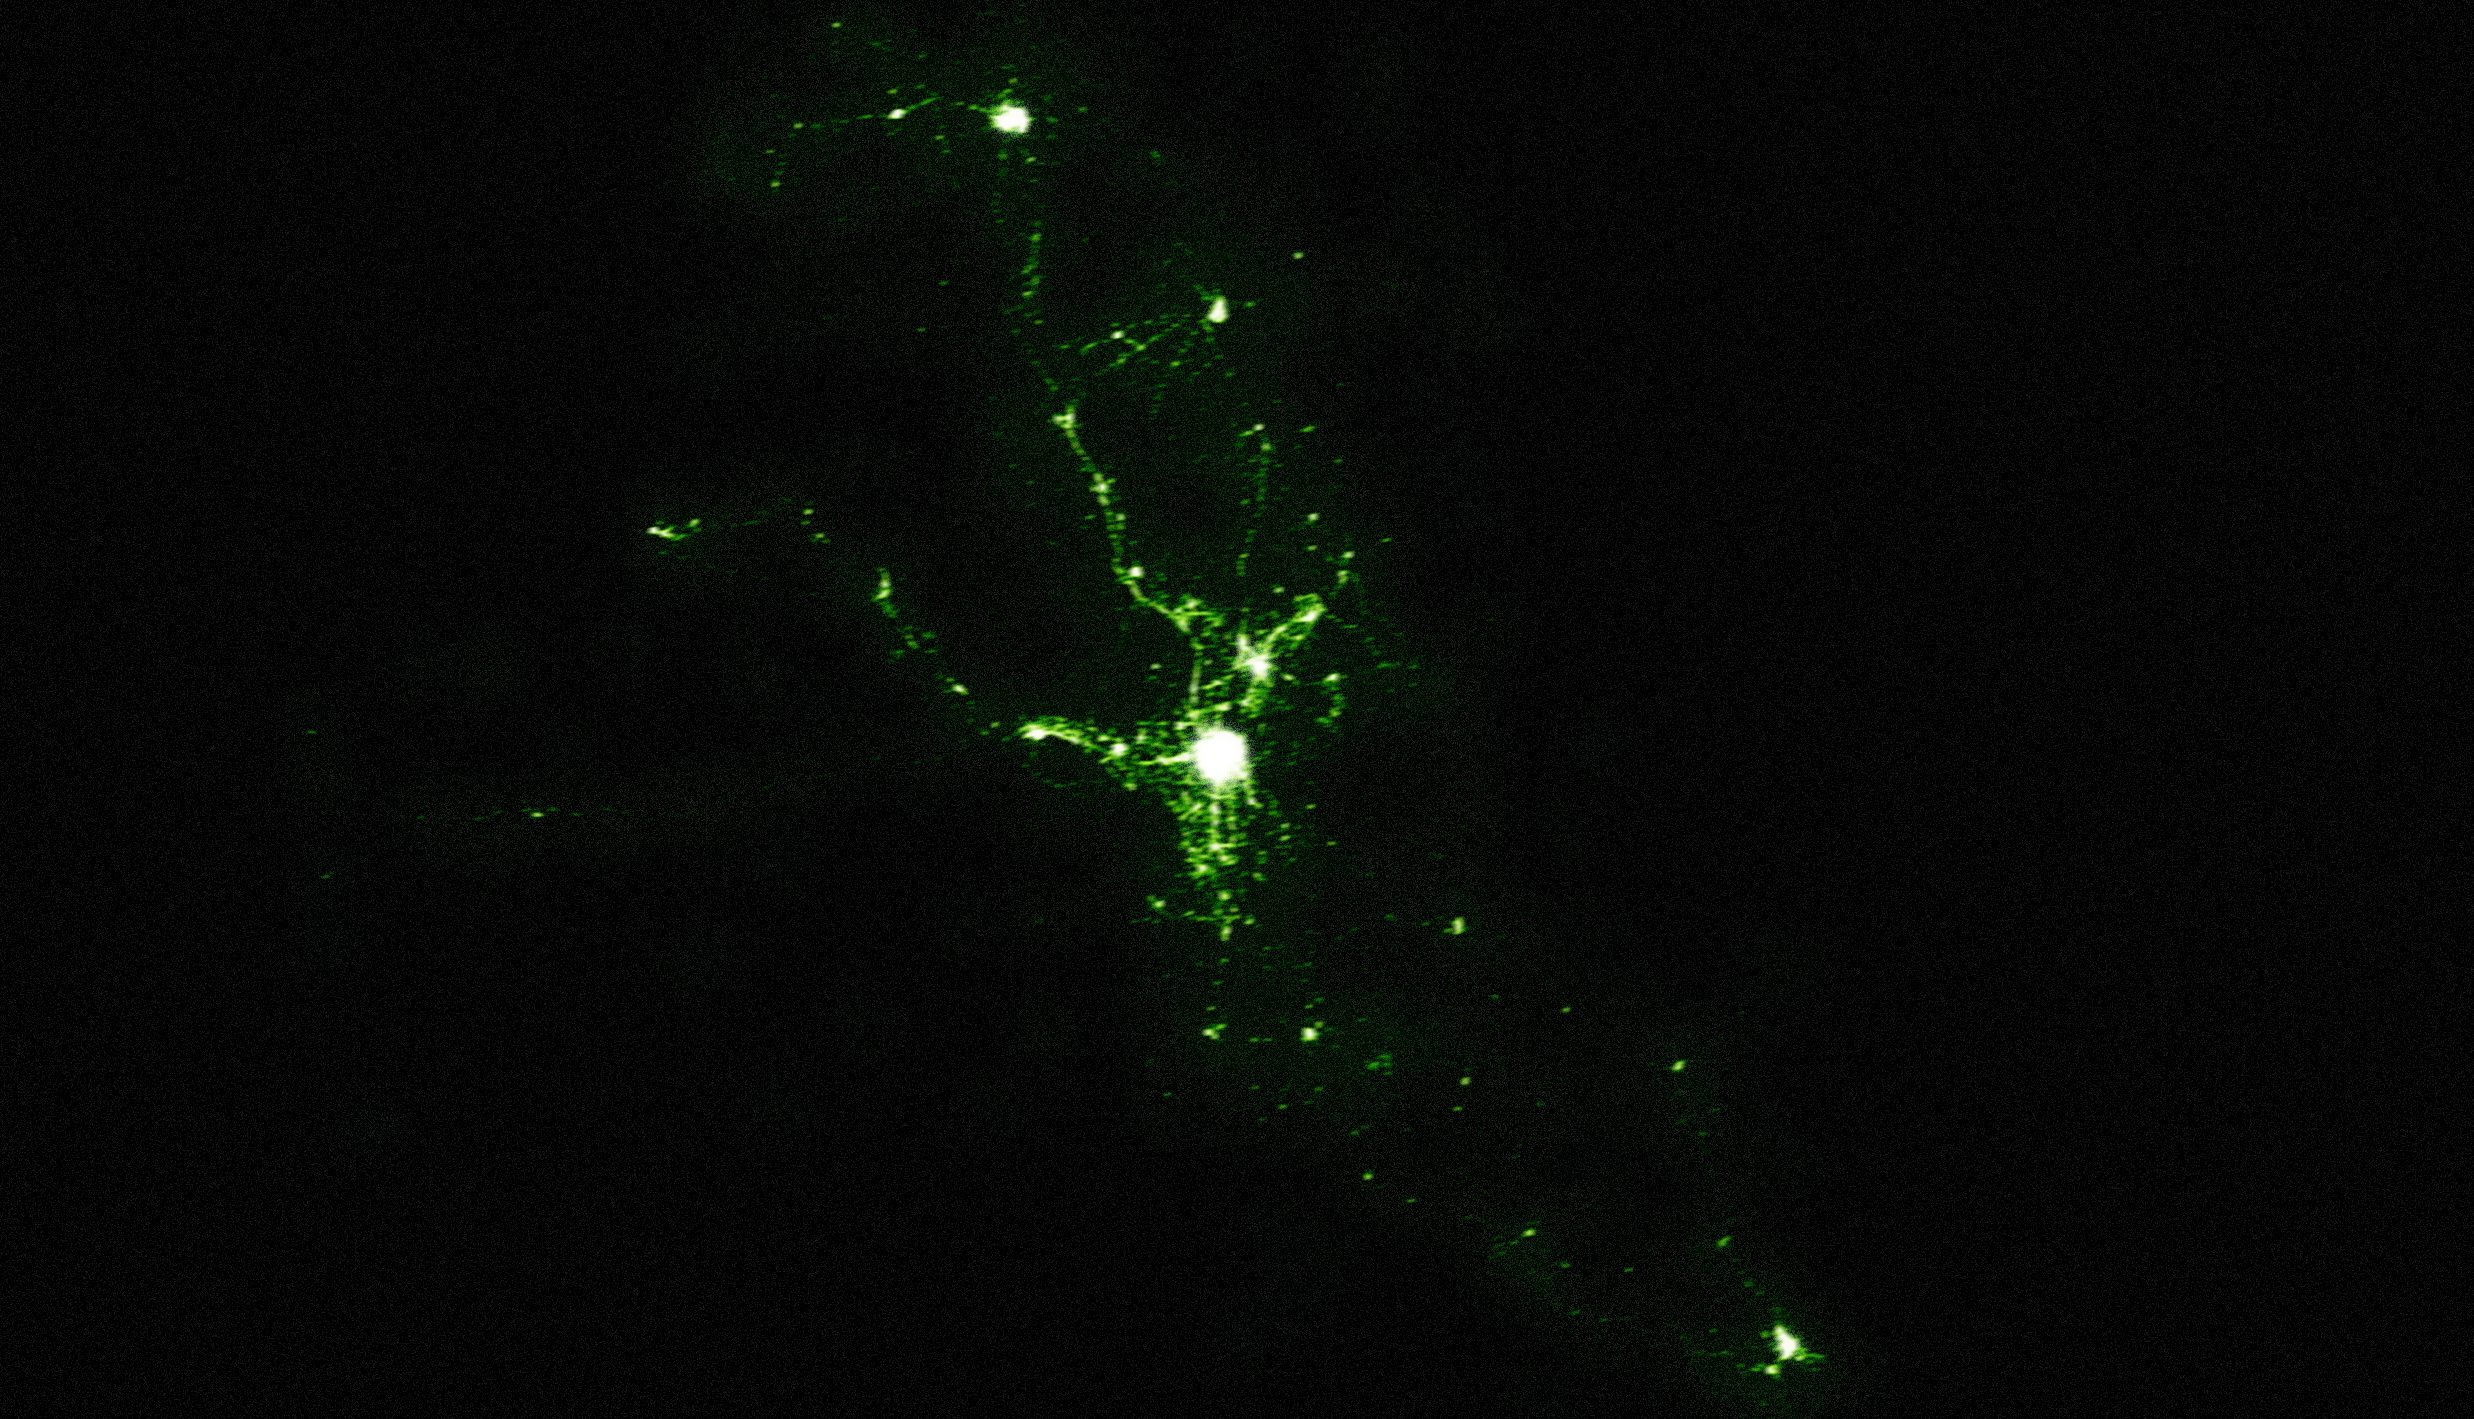
I wish I had the data for the past few years. It would have shown me in college, then moving to San Francisco. I could have seen the daily commute I did for a few years, and then the change to working from home. Imagine a heatmap on a map showing where I spend my time. While I was commuting to work you would have been able to make out the route of the train I took every day, and the amount of time I spent simply getting to and from the office. Compare that with my current lifestyle, which now involves either working from my home or my girlfriend’s place, which would also show a kind of “commute”, but this one is very different. This commute represent a shift in where I spend my time, and even beyond showing a change in my work life, it also signifies the strengthening of our romantic relationship. This is a visual representation of a very meaningful part of my life. Being able to visually see this movement is a way to quantify important changes. I imagine creating some amazing looking visual images of this type of data and hanging them on the wall. A single image would represent so much.

Challenges
The biggest challenge is going to be keeping new data updated and old data accessible as technology changes. In another year or two I will have a different mobile device, at which point I’ll have to figure out how to use the new device to keep the position reports updated. In another ten years who knows what kind of device I might be carrying around in my pocket. There’s just no way to predict that kind of stuff. So every few years I’ll have to figure out how to keep my reports updated using new technology. I’ll also have to adapt to changes in how I store that data. Storing it in a database works well now, but inevitably I’ll have to migrate that data from one database to another, or even move from a relational database to some other form of storage. This means I’ve got to either stay geeky enough to know how to implement this stuff for the rest of my life, or I’ve got to figure out a solution that literally requires no changes for the next few decades (I don’t think this is at all possible).

There are also some more immediate challenges. I don’t know how to keep my positions logged as I travel internationally yet. Even as I’m in the US I’ve got to ensure that the logging software is always running on my phone. My phone needs to be on at all times for the reports to come in. Ideally I’m going to try to write my own custom software to do exactly what I want, just so I know how it works under the hood in case something breaks or I upgrade devices. I’m not stoked about the fact that I’m tied to software written by someone else. I’ve also obviously got to keep the webserver that receives the reports up and running at all times. I’ll probably try to move to more of a database in the cloud approach using Amazon SimpleDB and EC2 so I can rely on Amazon instead of my current web host (I imagine I’ll always be relying on some company to handle this kind of stuff).

I’m excited about the possibilities for using this data in a few years, I just hope I can keep the position feed coming in.

Standard