
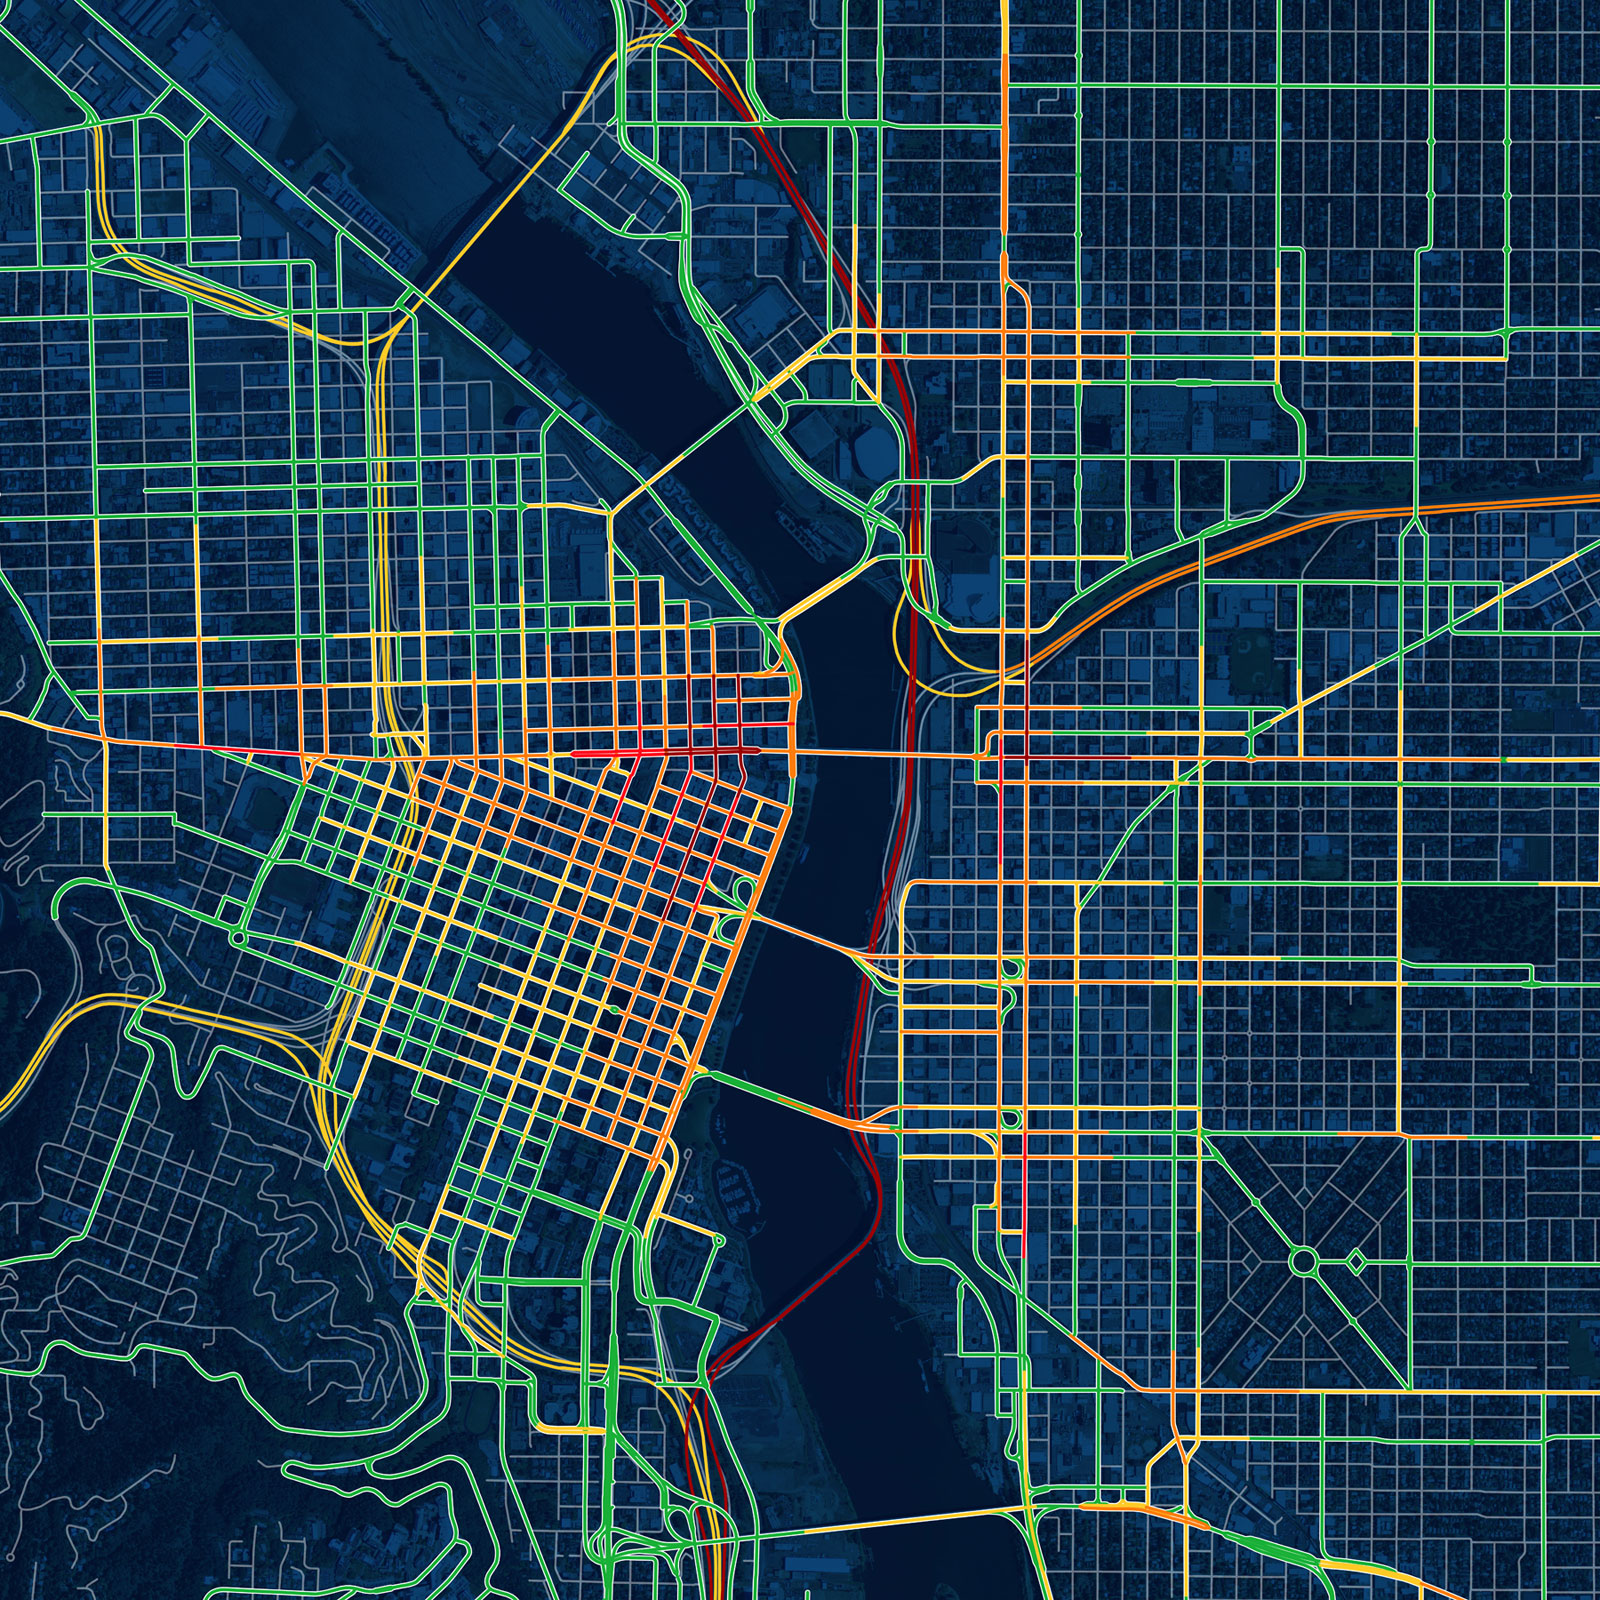
This map mimics a typical traffic map but represents the number of driving under the influence (DUI) arrests along each street over the course of 10 years. Red, orange, yellow, and green are used to denote relative frequencies of DUIs.

Click the image above for a larger version. Or download the full resolution file (53 megs).
You can see the highest density of DUI arrests in Old Town, particularly along Burnside and 3rd Ave. Zooming all the way in and you can even see the detail of the satellite imagery showing the buildings.

Interactive Version
You can play with the interactive version below, or here’s a direct link to view it full size. The interactive version lets you zoom in and out and pan around.
Acrylic Print
This was printed on a 30″ x 30″ sheet of acrylic.

The Source Data
The crime data can be downloaded from CivicApps, Portland’s data portal. Here’s a direct link to the FTP site that contains multiple years of data. The crime data was filtered to only include DUIs. As always when looking at crime data, remember this is where the most people are arrested, which isn’t necessarily the same as where the most people are actually driving drunk.
The street data was an extract taken from OpenStreetMap, provided by MapZen. The street data itself is copyright OpenStreetMap contributors.
The satellite imagery was from the National Agriculture Imagery Program (NAIP) and was downloaded through the Oregon Imagery Explorer.
High Resolution Download
If you’d like to make your own high-res print, the full resolution file (9,768 pixels square) is available for download (53.3 megs).
Deviant Cartography Show
This piece will be on display as part of the Deviant Cartography show at the Diode Gallery in Portland. Come see the show Thursday April 2, 6-9pm.

I would love to get you in touch with the folks at the http://www.firelab.org/ The fire progression maps are beautiful and I could probably dig up my circa 2005 email asking if we could make a travel education/art exhibit from both the predictive and actual fire perimeter work. It would be a wonderful discussion about climate change, the challenge of living in nature, western values about life and death, etc. Please let me know if you are interested. I have zero art skill I just know this fire mapping information is beautiful and informative – just like the work you are currently doing.